Figures & data
Table 1. Sociodemographic parameters, numbers, percentages.
Table 2. Knowledge of tetanus and vaccine.
Table 3. Tetanus vaccine status of healthcare workers.
Table 4. Comparison of sociodemographic characteristics and level of knowledge about tetanus and vaccine (χ2).
Table 5. Evaluation of none-vaccination according to sociodemographic characteristics (χ2).
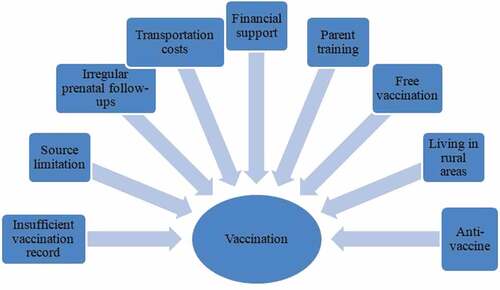
Figure 1. Factors affecting vaccination in Sub-Saharan Africa.