Figures & data
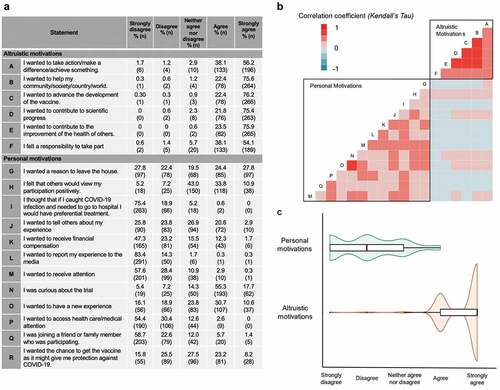
Figure 1. Respondents’ motivations for participating in COV001. (a) Respondents’ agreement with statements regarding altruistic and personal motivations. (b) Correlation between participants responses to individual altruistic and personal motivation statements (Kendall’s Tau). (c) Spread of responses to altruistic and personal motivation statements.
Box 1. Participants’ comments regarding their motivations for participating in the COV001 vaccine trial.
Figure 2. How participants’ age affected their motivations and concerns about participating in COV001. (a) Younger people (under 25 and 25–34) were more likely to have personal motivations than older people. (b) Younger people (under 25) also reflected higher levels of concern about trial safety.
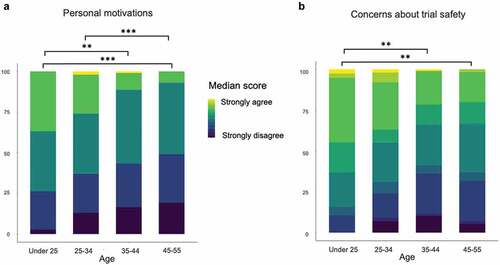
Figure 3. Participants’ perceptions of risk relating to the trial: (a) Proportions of participants in agreement with statements regarding risk of participating in COV001. (b) Participant responses to statements regarding risk of participating in COV001. Responses to survey statements were coded numerically for analysis: strongly disagree = −2; disagree = −1; neither agree nor disagree = 0; agree = 1; strongly agree = 2. For box plot, thick black line indicates median, box edges indicate lower and upper quartiles.
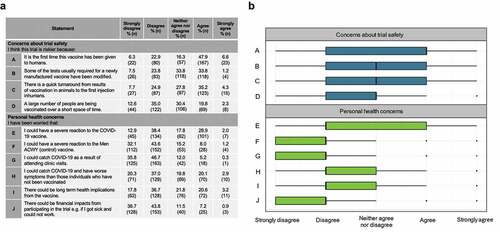
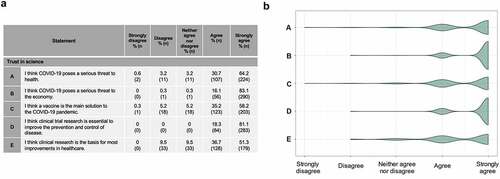
Figure 4. Respondents’ trust in science (a) Respondents’ agreement with statements regarding COVID-19 and science. (b) Spread of responses to statements assessing trust in science.