Figures & data
Figure 1. The labeling problem in correlates analysis. (a) In field trials of vaccine efficacy with pathogens that are not universally prevalent, the infected study group is comprised of vaccine recipients who were definitively exposed to the virus, while the uninfected study group consists of both vaccine recipients who were and others who were not exposed to the virus. (b) The ideal information needed to support discovery of Correlates of Protection (CoP) is the true protection status of exposed individuals. (c) Case-control analysis based on infection status defines Correlates of Risk (CoR) based on comparison of immune response features of infected vaccine recipients (gray) with those observed among uninfected vaccine recipients (purple). However, unless all vaccine recipients were exposed and/or the vaccine is completely effective, the uninfected class is comprised of subjects that exhibit a protective response (red, UP-uninfected protected) and those that do not (blue, UU-uninfected unprotected), but remained uninfected because they were not exposed. While CoR discovery power is improved by increasing the sample size of the uninfected class, it remains reduced by the inclusion of UU subjects.
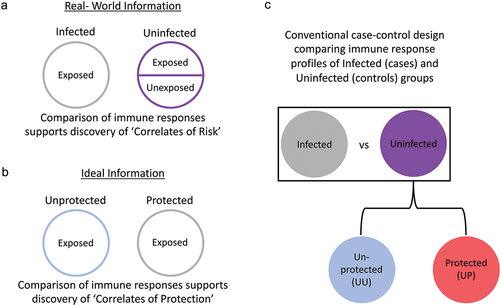
Figure 2. Graphical illustration of simulated data. (a) The ability to resolve CoR depend critically on the overall efficacy (left) of the vaccine, which is the fraction of vaccine recipients that mounted a protective response, and the effect size (right), which is the magnitude and spread of response distributions between protected (red) and unprotected (blue) participants, visualized for two exemplary variables. (b) To model immunogenicity data for differently distinct and effective vaccines, two populations (U and P) were assigned three normally distributed, uncorrelated immune response parameters (μ) that varied in distance (d) from each other defined in terms of standard deviations from the mean (SD). Parameter space ranged from distances of 0.0–5.0 SD and efficacy (e) of 5–50%.
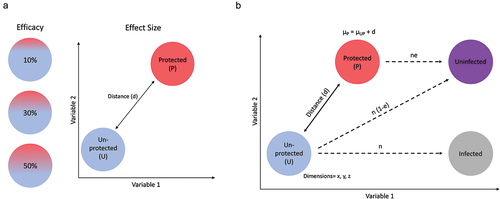
Figure 3. Disambiguation of UP and UU improves power and confidence in correlates. Variable (V) biplots of feature 1 and feature 2 for infected (gray) and uninfected (purple) vaccine recipients (top) and for uninfected unprotected (blue) and uninfected protected (red) vaccine recipients (bottom) for distributions with variable efficacy (15% and 30% efficacy) and effect size (0.5 SD and 2 SD). Violin plots show group distributions for V2 (p values by ANOVA with Tukey’s MHC; *p < .05; **p < .01; ****p < .0001).
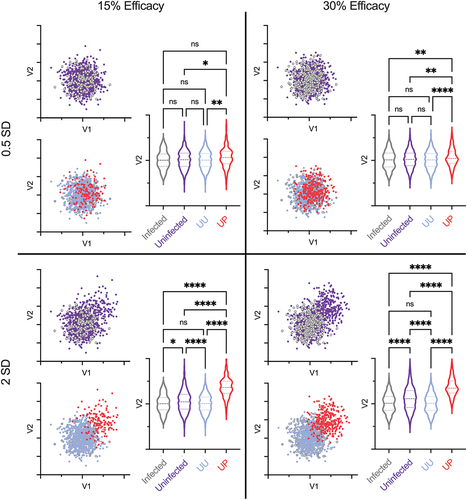
Figure 4. Accuracy of protection status label inferences. (a–d) Evaluation of ML algorithms to accurately predict protection status. Mathew’s correlation coefficient (MCC) (a), Protection Predictive Value (b), Specificity (c) and Sensitivity (d) calculated using data with protection status labels inferred from unsupervised analysis (K-means), supervised analysis (SVM) or P/U ML (RN-SVM) as compared to case-control analysis (infection status labels) or ground truth (actual protection status). Performance metrics are presented for input data sets with variable immunogenicity response variable distance (x-axis) and efficacy (columns). Error bars represent standard deviation across replicates. MCC could not be calculated when all samples were predicted to a single class.
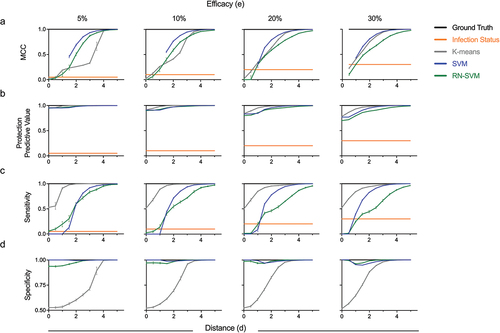
Figure 5. Strength and confidence of correlate discovery from inferred protection status. (a,b) Evaluation of effect size and confidence in correlate identification. Cliff’s delta (a) and statistical significance (b) of the held-out immunogenicity feature calculated from inferred protection status labels inferred from unsupervised analysis (K-means), supervised analysis (SVM) or P/U ML (RN-SVM), as compared to case-control analysis labels (infection status labels) or ground truth (actual protection status). Correlate metrics are presented for input data sets with variable immunogenicity response variable distance (x-axis) and efficacy (columns). Statistical significance was calculated using a two-sided Wilcoxon-Mann-Whitney U test with the null hypothesis that the two groups being compared were identical. Error bars represent standard deviation across replicates. Values could not be calculated when all samples were predicted to a single class.
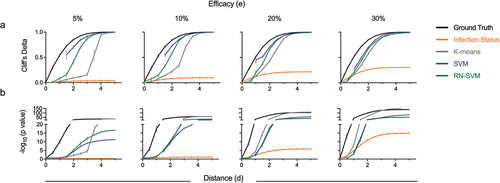
Figure 6. Effect of sample size on protection status inferences and correlates discovery. (a) Classification accuracy (MCC) of protection status labels predicted by RN-SVM for different sample sizes (n = 50, 250, 500, 1000). (b) Correlate effect size (Cliff’s delta) for the held-out variable. Metrics are presented for input data sets with variable immunogenicity response distance (x-axis) and efficacy (columns) and sample sizes. Error bars represent standard deviation across replicates. Values could not be calculated when all samples were predicted to a single class.
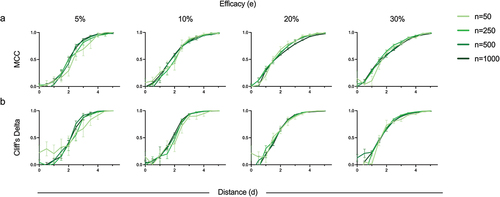
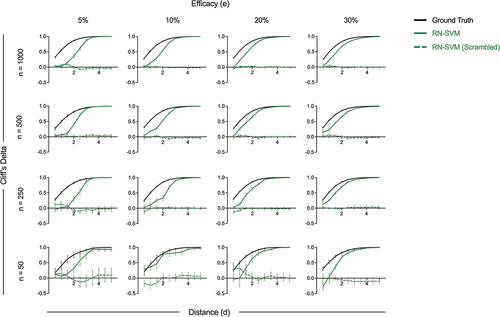
Figure 7. Robustness of Reliable Negative SVM algorithm evaluated using correlate effect size. Correlate effect size (Cliff’s delta) for the held-out and scrambled held out variable calculated based on inferred protection status label for RN-SVM algorithm as compared to ground truth protection status. Metrics are presented for input data sets with variable immunogenicity response distance (x-axis) and efficacy (columns). Each row represents the different sample sizes. Error bars represent standard deviation across replicates.