Figures & data
Figure 1. The inclusion flow charts defining the pertussis diagnosed and undiagnosed cohorts, and general population.
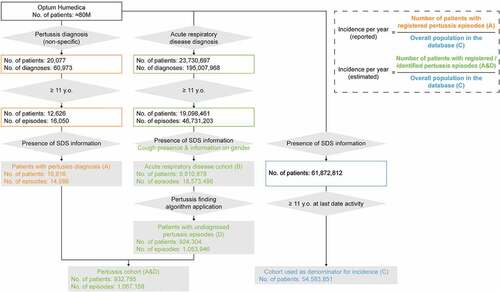
Table 1. Demographic characteristics of the pertussis diagnosed and undiagnosed episodes and ARD episodes.
Figure 2. Diagnosed pertussis incidence in Optum Humedica vs registered (reported) cases according to CDC.
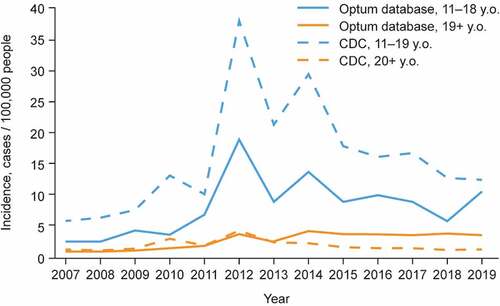
Figure 3. Estimated pertussis incidence (inclusion of undiagnosed pertussis cases).
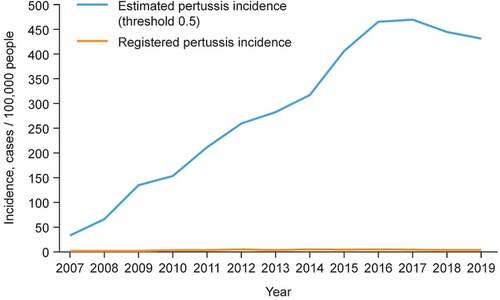
Figure 4. Pertussis incidence by age group: (a) Based on diagnosed and algorithm-identified (undiagnosed) pertussis episodes in Optum Humedica vs (b) Based on diagnosed pertussis episodes in Optum Humedica.
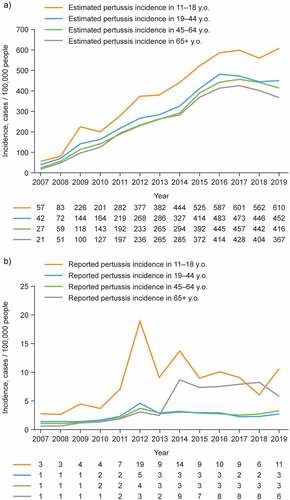
Figure 5. Prevalence of underlying morbidities/conditions (after cohort matching).
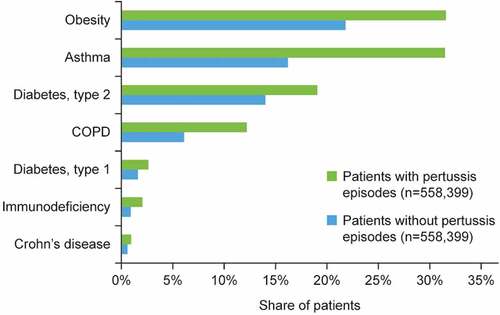
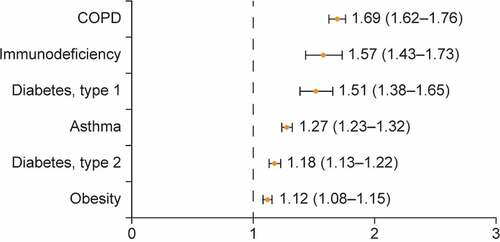
Figure 6. Odds ratios (95% confidence interval) of underlying morbidities/conditions impacting the likelihood pertussis in adolescents and adults with ARD.
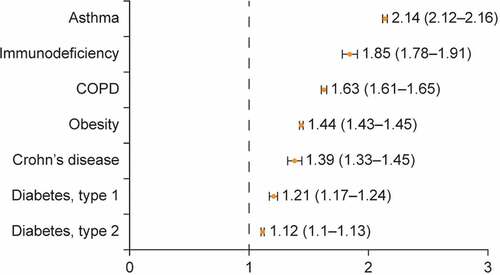
Figure 7. Odds ratios (95% confidence interval) of underlying morbidities/conditions impacting the likelihood of severe pertussis in adolescents and adults with ARD.