Figures & data
Figure 1. CAR-T cell expansion and persistence in a patient with in a kidney transplant recipient with PTLD (a) Time course of reconstitution of white blood cell, neutrophil, and lymphocyte counts after lymphodepleting chemotherapy and CAR-T cell infusion. Timepoints where flow cytometry for the detection of CAR-T cells was performed are indicated by pink triangles. (b) Analysis of CAR-T cell numbers in the peripheral blood of our patient on d +27, +42, and +60 post CAR-T cell treatment. CAR-T cells were identified by staining of the expression of the CAR on the cell surface and co-staining with anti-CD3 and other T cell markers (Supplementary Table 1). (c) CAR-T cell memory subtypes were determined on d +42 and +60 post CAR-T treatment by co-staining for CD45RA and CD62L. Central memory (CM) and effector memory (EM) CAR-T cells are shown in the right lower and left lower quadrants, respectively. (d) Expression of exhaustion markers PD1, LAG3, and TIM3 on CAR-T cells was determined by flow cytometry on d +42 and +60 post CAR-T treatment. (e) Serum concentrations of 22 different T cell-related cytokines/chemokines were determined in our patient on d +27, +42 and +60 post CAR-T treatment using CodePlex secretome technology.
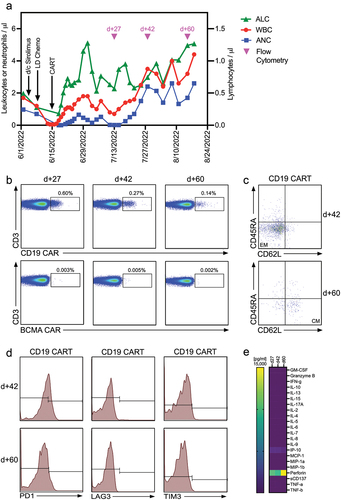
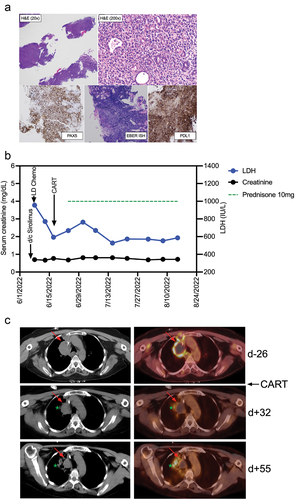
Figure 2. Diagnosis and clinical course of PTLD in a kidney transplant recipient treated with CD19 CAR-T cells histologic images from the gastric antral soft tissue nodule biopsy, examination at low power magnification demonstrates thin cores of tissue with a focal area of intact gastric mucosa (right side of figure), and architectural effacement of the remaining tissue by a hypercellular diffuse lymphoid infiltrate (H&E stain, 20× magnification). Examination at higher magnification reveals an infiltrate of large atypical lymphoid cells forming sheets and infiltrating residual mucosal epithelium, with moderate cytologic atypia and pleomorphism (H&E stain, 200× magnification). Immunohistochemical and in situ hybridization (ISH) stains demonstrate strong diffuse positivity of the CD20-expressing lymphocytes for PAX5 (40× magnification), EBER ISH (40× magnification), and PDL1 with negativity for CD10 and Ki-67-positivity in 90% of cells (data not shown). (b) Clinical course after discontinuation of sirolimus, lymphodepleting (LD) chemotherapy with fludarabine/cyclophosphamide, and CAR-T cell infusion. Post-CAR-T corticosteroid dosing is shown as a green dotted line, serum concentrations of lactate dehydrogenase (LDH) and creatinine are shown in blue and black, respectively. (c) PET-CT Images from before CAR-T cell treatment (d-26), and two timepoints (d + 32 and d + 55) after CAR-T cell treatment. The upper panel (pre-CAR-T; d-26) shows an index right upper mediastinal mass (left: CT, right: fused PET/CT) measuring 5.0 × 3.6 cm with central photopia and peripheral increased F-fluorodeoxyglucose (FDG) uptake on PET representing active lymphoma (indicated by red arrow). The middle panel (d + 32) shows a decreased size (3.4 × 3.0 cm) of the index lesion with mild residual peripheral FDG uptake representing partial metabolic response to the treatment. The green star indicates a new infectious pulmonary process in the right upper lobe. The lower panel (d + 55) shows a further decrease in size (3.0 × 2.6 cm) of the mediastinal index lesion with resolution of the peripheral FDG uptake, representing a complete metabolic response.