
Figures & data
Figure 1. Participant disposition in (a) Cohort 1 (participants 42–56 days of age at Dose 1), (b) Cohort 2 (participants 7–<12 months of age at Dose 1), (c) Cohort 3 (participants 1–<2 years of age at Dose 1), and (d) Cohort 4 (participants 2–<6 years of age at Dose 1).
Table 1. Participant demographics.
Figure 2. PCV13 serotype-specific IgG GMCs 1 month after the infant series (Cohort 1) or 1 month after the last dose (Cohorts 2, 3, and 4) and GMFRs from baseline to 1 month after the last vaccination.
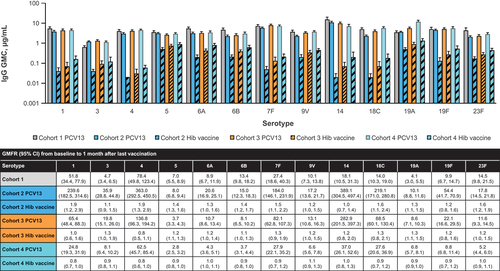
Figure 3. PCV13 serotype-specific OPA GMTs 1 month after the infant series (Cohort 1) or 1 month after the last dose (Cohorts 2, 3, and 4) and GMFRs from baseline to 1 month after the last vaccination.
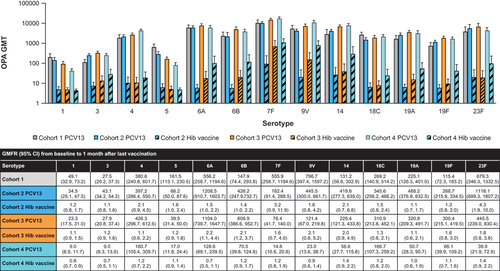
Figure 4. Percentage of participants with local reactions within 7 days after each dose in (a) Cohort 2, (b) Cohort 3, and (c) Cohort 4.
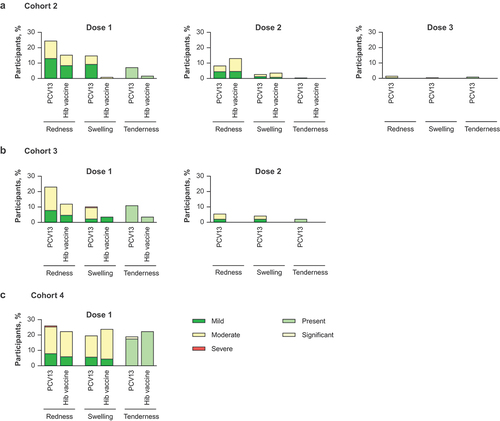
Figure 5. Percentage of participants with systemic events within 7 days after each dose in (a) Cohort 2, (b) Cohort 3, and (c) Cohort 4.
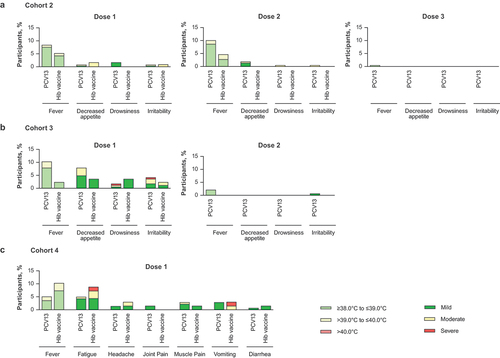
Table 2. Summary of AEs reported from the signing of informed consent document through 1 month after the infant series (Cohort 1) or 1 month after the last dose (Cohorts 2, 3, and 4)a.