
Figures & data
Figure 1. CONSORT diagram for patient selection and samplings.
Table 1. Demographic and clinic characteristics of patients included in the study.
Figure 2. Evolution of the seroprotection rate against the four human influenza viruses type A and B in the group of workers who had been vaccinated at least the previous season (V), and in those who had never been vaccinated against influenza (NV). ****, p < .0001.
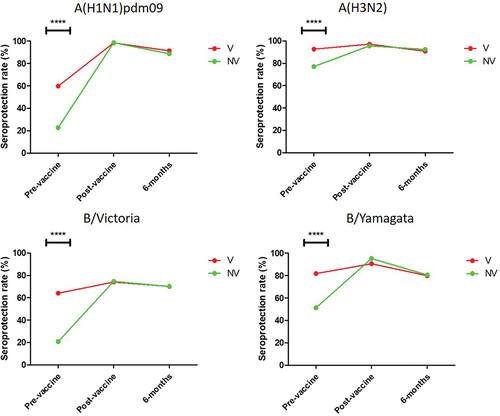
Figure 3. Evolution of the GMTs against the four human influenza viruses type A and B in the group of workers who had been vaccinated at least the previous season (V), and in those who had never been vaccinated against influenza (NV). *, p < .05; **, p > .01; ****, p < .0001.
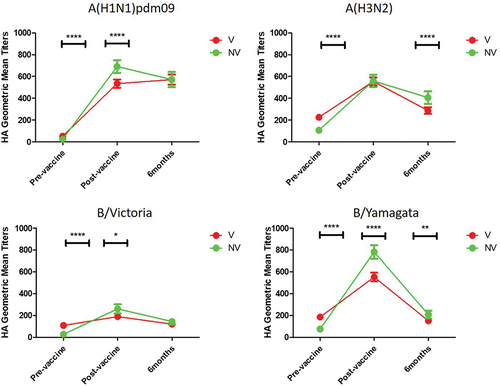
Figure 4. Seroconversion rate (SCR) against the four human influenza viruses type A and B in the group of workers who had been vaccinated at least the previous season (V), and in those who had never been vaccinated against influenza (NV). H1, A(H1N1)pdm09; H3, A(H3N2); BV, B/Victoria; BY, B/Yamagata; ****, p < .0001.
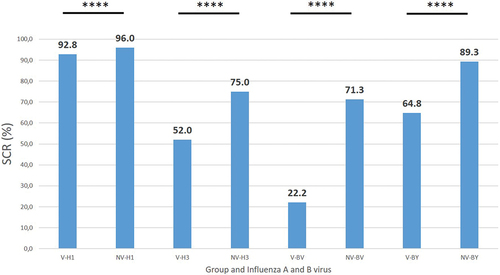
Figure 5. Logistic regression of hemagglutinating antibody titers as a function of the age of the individuals included in the study. V, vaccinated against influenza at least the previous season; NV, never vaccinated against influenza; LR, Logistic Regression; BV, B/Victoria; BY, B/Yamagata.
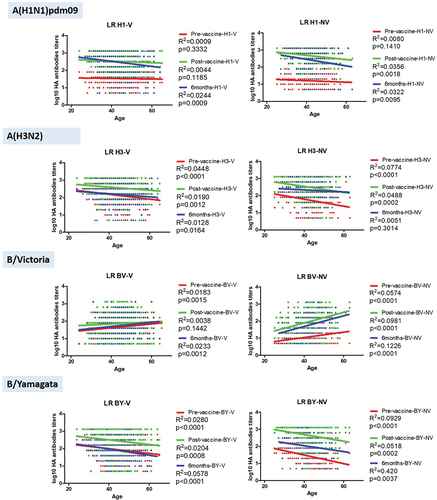
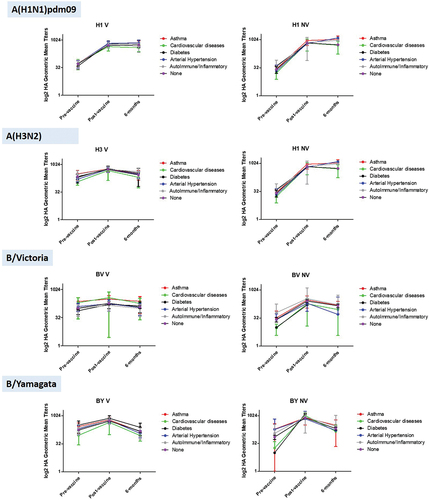
Figure 6. Log2 HA GMTs for V and NV groups against each influenza A and B virus analyzed for the different pathologies recorded in the study subjects. V, vaccinated against influenza at least the previous season; NV, never vaccinated against influenza; BV, B/Victoria; BY, B/Yamagata.
Supplemental Material
Download PDF (481.6 KB)Data availability statement
The data that support the findings of this study are available from the corresponding author upon reasonable request.