
Figures & data
Figure 1. Flowchart of the literature searching and screening in the study.
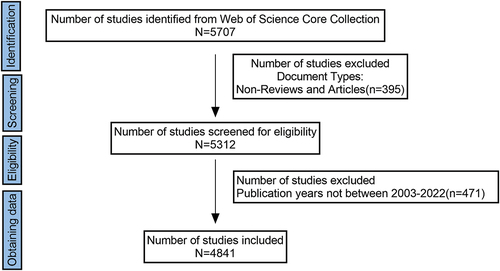
Figure 2. Global trend of publications and meanTCperyear of citations on RCC immunotherapy from 2003 to 2022.
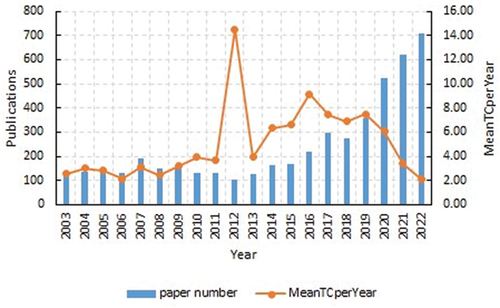
Figure 3. (a) Geographic distribution map based on the total publications of different countries/regions. (b) Co-authorship between countries. (c) Co-authorship between institutions.
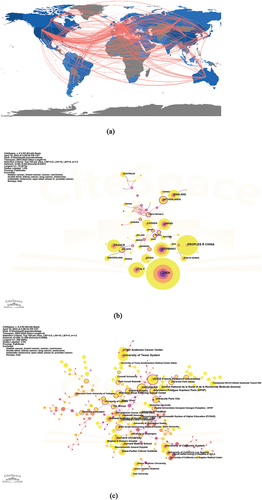
Table 1. Top 10 co-authorship: countries, institutions, and authors.
Table 2. The top 10 countries with high centrality value.
Table 3. Top 10 references with highest citations.
Figure 4. (a) A timeline view for co-cited references associated with RCC immunotherapy. (color version of figure is available online.) (b) CiteSpace visualization map of top 25 references with the strongest citation bursts from 2003 to 2022.
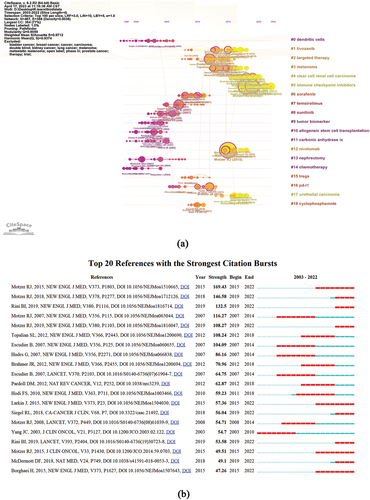
Table 4. Top 10 journals and authors with highest citations.
Figure 5. (a) Keywords co-occurrence map of publications on RCC immunotherapy. (b) A timeline view for keywords associated with RCC immunotherapy. T (c) CiteSpace visualization map of top 25 keywords with the strongest citation bursts of publications in the field of RCC immunotherapy from 2003 to 2022.
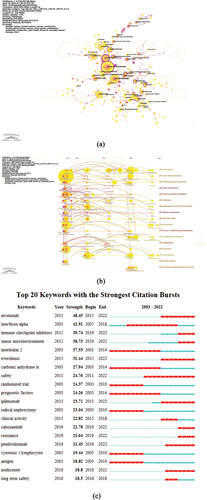
Table 5. Top 20 keywords in terms of records.
Data availability statement
The original data supporting the conclusion of this article will be provided by the author without any reservations.