Figures & data
Figure 1. Flowchart of patient selection.
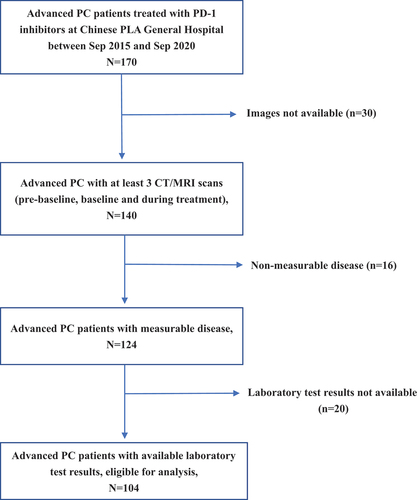
Figure 2. Case study of a patient with PC with HPD during treatment with a PD-1 inhibitor.
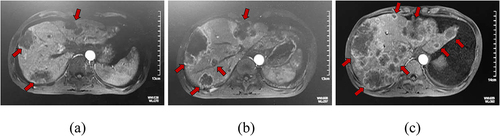
Table 1. Characteristics of patients with advanced PC.
Table 2. Differences of patients’ characteristics between the non-HPD group and the HPD group.
Figure 3. Overall survival for HPD compared with PD without HPD in patients with immunotherapy.
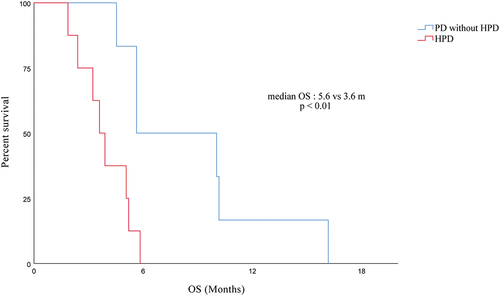
Figure 4. ROC curves of baseline CA19-9 predicting the occurrence of HPD during treatment with PD-1 inhibitors in patients with advanced PC.
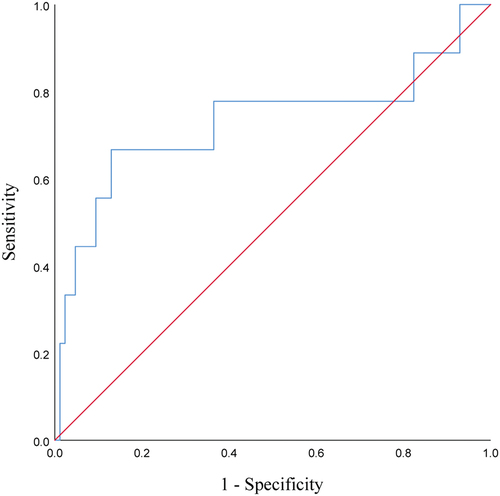
Table 3. Data related to ROC analysis of baseline CA19-9 predicted HPD.
Figure 5. ROC curves of the first month’s increase in CA19-9 predicting the occurrence of HPD during treatment with PD-1 inhibitors in patients with advanced PC.
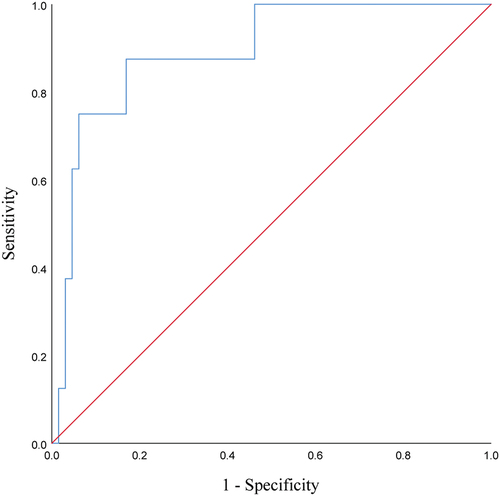
Table 4. Data associated with the ROC analysis of the first month’s increase in CA19-9 predicted HPD.
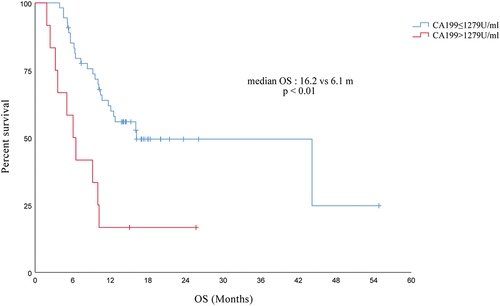
Figure 6. Comparison of OS between high and low CA19-9 levels in PC patients receiving immunotherapy.