Figures & data
Figure 1. Humoral responses induced by monovalent Omicron, monovalent Delta, and bivalent Omicron and Delta vaccines. (a) Immunization strategy for the immunization of rabbits. Rabbits received three doses of the DNA vaccine with different antigens on days 0, 7, and 21 and two additional doses of the S1 protein vaccine on days 35 and 49. Sera were collected on days 0, 28, and 56 for immunoassay. (b) Mean serum IgG titer curves of the three groups of rabbits over time. T0: before immunization; T3: day 28 post immunization; T4: day 42 post immunization; T5: day 63 post immunization. (c) Temporal IgG titer of rabbit serum against RBD and spike proteins measured by ELISA in the three animal groups immunized with either Delta, Omicron, or Delta and Omicron. (d) SARS-CoV-2 pseudovirus neutralization assay of rabbit serum at T5 against WT; Delta; and Omicron BA.1, BA.1(R346K), BA.2, BA.4/BA.5, and BA.2.75.
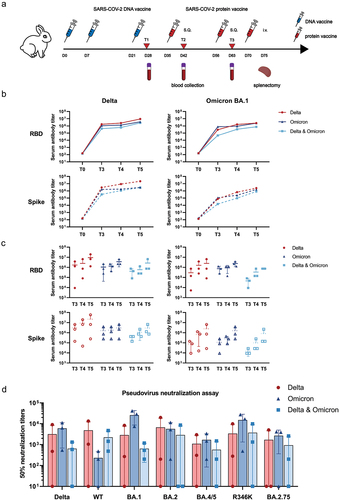
Figure 2. Isolation of spike-specific single B cells and functional testing of B cell clones. (a) Flow cytometry gating strategy to sort spike-specific B cells from rabbit splenocytes. (b) Summary of sorted single B cell clones, Delta spike-binding clones, Omicron BA.1 spike-binding clones, and RBD/ACE2 blocking clones. (c) Determination of the binding ability of Omicron and Delta spike-specific B cell clones from the culture supernatants by ELISA. (d) Detection of the ACE2 blocking capacity of spike-specific B cell clones from the culture supernatants by blocking ELISA. (e) Neutralization capability of spike-specific B cell clones from the culture supernatants at 50 ng/mL. (f) Venn diagram of the classification of the 21 clones.
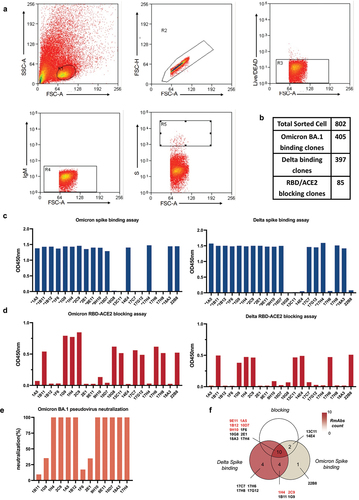
Figure 3. Profiles of RmAbs binding with SARS-CoV-2 spike and RBD proteins from various subvariants. (a) RmAbs that bound to the SARS-CoV-2 spike protein from WT; Delta; and Omicron BA.1, BA.2, BA.3, BA.5, XBB.1, BQ.1, and BQ.1.1 were identified by ELISA. (b) RmAbs that bound to the SARS-CoV-2 RBD protein from WT; Delta; and Omicron BA.1, BA.2, BA.3, and BA.5 were identified by ELISA. (c) Heatmap of the binding capacity of seven RmAbs against the spike and RBD proteins of WT, Delta, and Omicron and its variants. The value represents the OD value of ELISA at 1 μg/mL concentration.
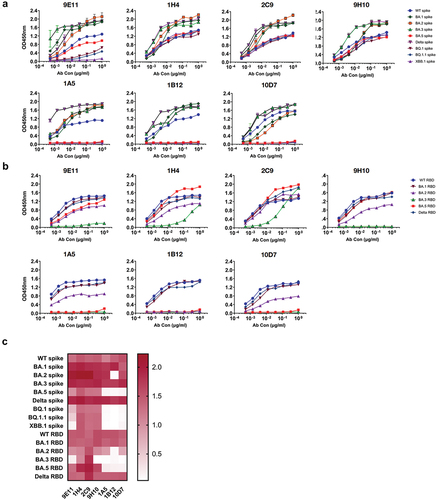
Figure 4. RmAb 9E11 binding kinetics with SARS-CoV-2 spike proteins by using biolayer interferometry analysis. (a) Spike proteins of Omicron BA.1, BA.2, and BA.3. (b) Spike proteins of BA.4/BA.5, BQ.1, and BQ.1.1. (c) Spike proteins of Omicron BF.7, XBB.1, and WT.
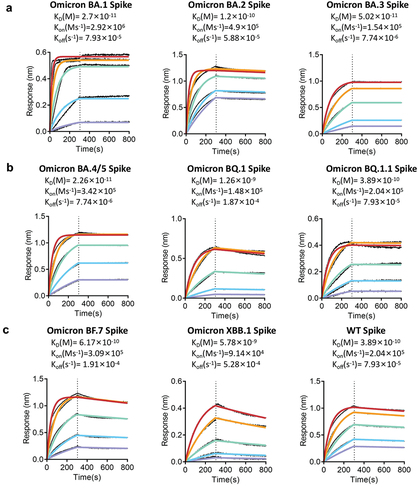
Figure 5. Neutralization capability of the identified RmAbs determined by pseudovirus neutralization assay. (a) the neutralization capability of seven RmAbs at 50 ng/mL against WT and Omicron BA.1, BA.2, BA.5, BA.2.75, and BA.1.1. (b) Pseudovirus neutralization assay of four RmAbs (9E11, 10D7, 1A5, and 1B12) against SARS-CoV-2 WT and Omicron BA.1, BA.2, BA.5, BA.2.75, and BA.1.1. The curves represent the inhibition rate of the SARS-CoV-2 pseudovirus entry into HEK293T cells overexpressing ACE2.
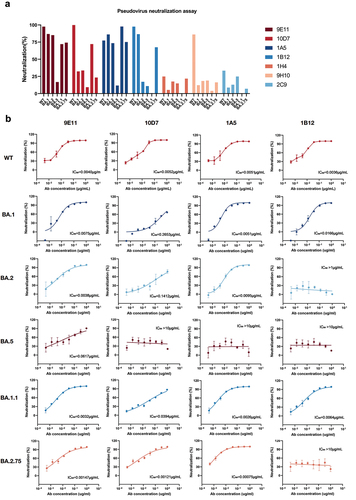
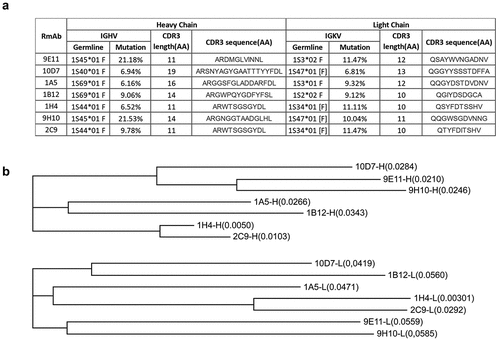
Figure 6. Genetic analysis of the isolated RmAbs. (a) Mutations in the variable regions, joining regions, and CDR3 regions of the heavy and light chains of RmAbs compared to their germline gene sequences. (b) a phylogenetic tree was constructed using the maximum-likelihood method for the heavy chain (above) and light chain (below) of seven neutralizing RmAbs. Branch lengths are scaled to visualize sequence diversification.