
Figures & data
Figure 1. Flow chart about the search strategy.
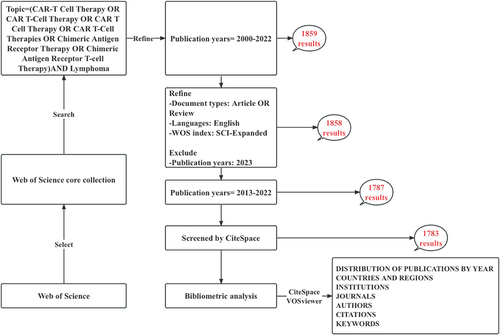
Figure 2. Distribution of publications and trends in the cumulative number of publications from 2000 to 2022. The blue bar graph represents the number of publications per year, and the solid orange line represents the cumulative number of publications.
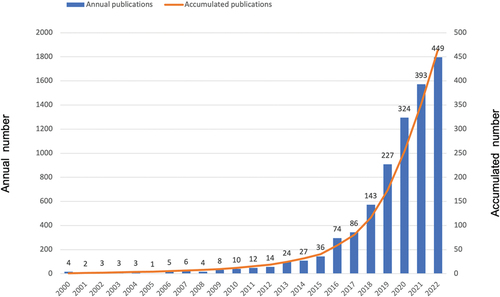
Figure 3. (a) The current status of publication volume on CAR-T cell therapy based on lymphoma research from 2013 to 2022 in the main countries is analyzed. (b) Scientific collaboration networks among all countries/regions. The size of each colored block represents the number of publications originating from that country/region, and the connections between countries indicate collaboration relationships.
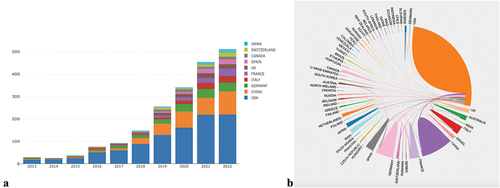
Table 1. Top 10 countries and regions by number of publications.
Table 2. Top 10 institutions by number of publications.
Figure 4. (a) The main sources of publications and the number of publications. (b) Three-fields plot. Network relationships among countries, sources, and authors. (c) Double image overlay of journals. Image parameters: a: 1; source circle size: 40; target circle size: 5; captured center point (radius): 0. The citing journals are located on the left, and the cited journals are located on the right. The colored paths (one orange and two green reference paths) represent the citation relationships.
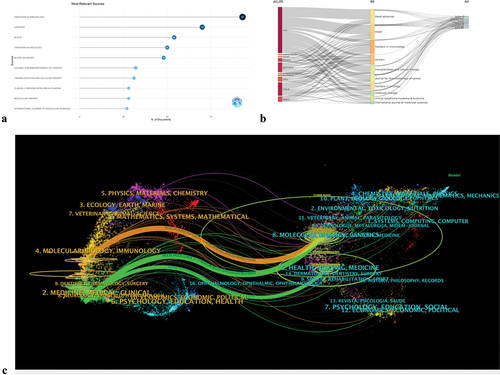
Table 3. Top 10 journals and co-cited journals.
Figure 5. Author collaborations. (a) Network visualization mapping of author collaborations. (b) Network visualization mapping of co-cited authors. (C) visualization of the density of author collaborations. (d) Density visualization mapping of co-cited authors. (e) Temporal overlay visualization mapping of author partnerships. (f) The higher the number of publications, the longer the bar; MCP indicates the number of coauthored articles with authors from other countries; SCP indicates the number of coauthored articles with authors of the same nationality.
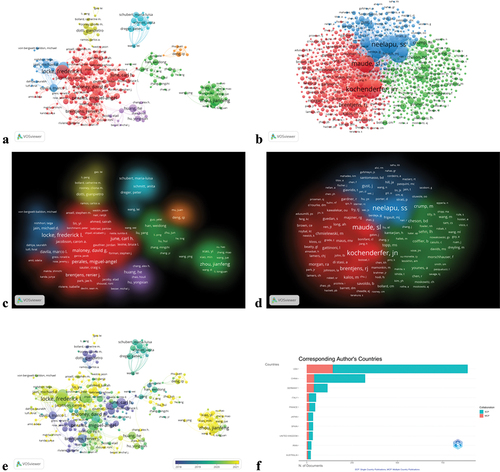
Table 4. Top 10 authors and co-cited authors.
Table 5. Top 10 co-cited references.
Figure 6. (a) Visualization of the co-citation analysis network, divided into two clusters in red and blue. (b) Clusters of references. A total of seven clusters were classified. (c) Top 20 references with the strongest citation bursts. The blue bars indicate references that have been published; the red bars indicate citation bursts.
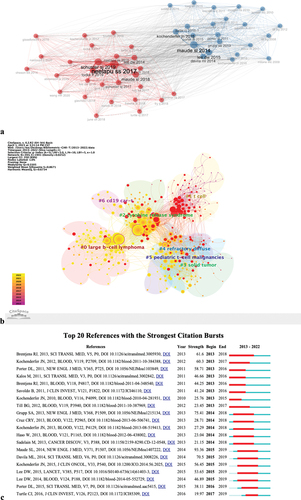
Figure 7. (a) Keyword-based word cloud map. (b) Trends topics based on annual distribution of keywords. (c) Timeline viewer of keywords. Footnote: Keywords were clustered into different items represented by six colors.
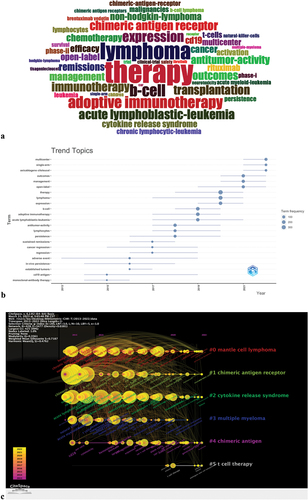
Table 6. The keywords for the CAR-T cell therapy research in the field of lymphoma (n ≥ 120).
Data availability statement
The data that support the findings of this study are available from the corresponding author, upon reasonable request.