
Figures & data
Figure 1. Design principle of LYB001.
RBD, receptor binding domain; VLP, virus-like particle.
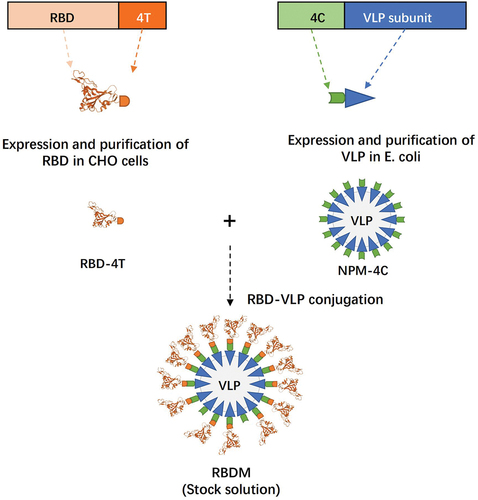
Figure 2. Study profile.
*One participant withdrew prior to booster vaccination due to prior receipt of a two-dose recombinant protein subunit vaccine against COVID-19 (ZF2001) other than ICV. †One participant was absent for blood collection at 90 days after the CoronaVac booster following two-dose ICV due to quarantine for COVID-19. ‡One participant was absent for blood collection at 90 days after the CoronaVac booster following two-dose ICV due to quarantine for COVID-19. §One participant was absent for blood collection at 14 days after the 30 μg LYB001 booster following three-dose ICV due to quarantine for COVID-19. ICV, inactivated COVID-19 vaccine; SS, safety set; I-FAS, full analysis set for immunogenicity; I-PPS, per protocol set for immunogenicity (I-PPS1: I-PPS of 14 days after the booster; PPS2: I-PPS of 28 days after the booster), IPS, immunogenicity persistence set (IPS1: IPS of 90 days after the booster).
Table 1. Baseline characteristics of the participants.
Table 2. Overall adverse events or reactions after booster administration.
Figure 3. VSV-based neutralizing antibody titers against prototype SARS-CoV-2 and Omicron BA.4/5 strain.
Antibody values less than the lower limit of detection (LOD = 10) were replaced by 0.5 × LOD. The individual data in the I-I-30 L, I-I-60 L, I-I-C, and I-I-I-30 L groups are indicated by Δ, ▽, ○, ▲, respectively. VSV, vesicular stomatitis virus; I-I-30 L, 30 μg LYB001 booster after two-dose inactivated COVID-19 vaccine; I-I-60 L, 60 μg LYB001 booster after two-dose inactivated COVID-19 vaccine; I-I-C, CoronaVac booster after two-dose inactivated COVID-19 vaccine; I-I-I-30 L, 30 μg LYB001 booster after three-dose inactivated COVID-19 vaccine.
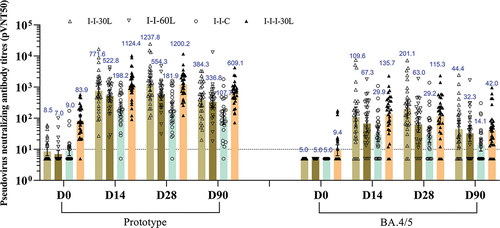
Figure 4. The spike protein binding IgGs at baseline and 14, 28, and 90 days after booster administration.
Antibody values less than the lower limit of detection (LOD = 20) were replaced by 0.5 × LOD. The data in the I-I-30 L, I-I-60 L, I-I-C, and I-I-I-30 L groups are indicated by Δ, ▽, ○, ▲, respectively. I-I-30 L, 30 μg LYB001 booster after two-dose inactivated COVID-19 vaccine; I-I-60 L, 60 μg LYB001 booster after two-dose inactivated COVID-19 vaccine; I-I-C, CoronaVac booster after two-dose inactivated COVID-19 vaccine; I-I-I-30 L, 30 μg LYB001 booster after three-dose inactivated COVID-19 vaccine.
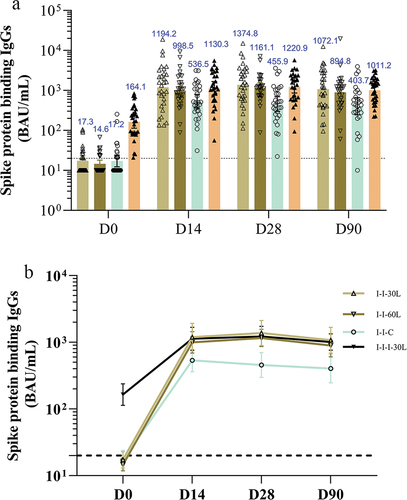
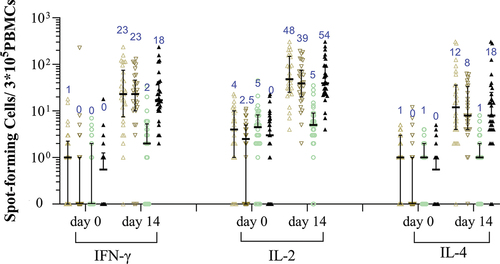
Figure 5. RBD-specific IFN-γ, IL-2, or IL-4 secreting T-cells measured by ELISpot assay.
Bars and numbers in the figure indicate group medians, and error bars indicate interquartile range. The individual data in the I-I-30 L, I-I-60 L, I-I-C, and I-I-I-30 L groups are indicated by Δ, ▽, ○, ▲, respectively. RBD, receptor binding domain; I-I-30 L, 30 μg LYB001 booster after two-dose inactivated COVID-19 vaccine; I-I-60 L, 60 μg LYB001 booster after two-dose inactivated COVID-19 vaccine; I-I-C, CoronaVac booster after two-dose inactivated COVID-19 vaccine; I-I-I-30 L, 30 μg LYB001 booster after three-dose inactivated COVID-19 vaccine.
Supplemental material
Supplemental Material
Download PDF (236.7 KB)Data availability statement
The data used in this study are available from the corresponding author upon reasonable request.