
Figures & data
Figure 1. Time-flow diagram of the two phases of the study.
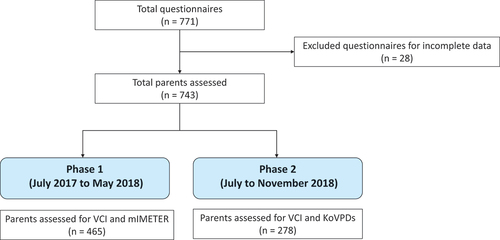
Table 1. Study population characteristics.
Figure 2. Parallel analysis. The values reported on the x-axis represent the factor number to be included in the analysis while on the y-axis the values of eigenvalue.
Figure 3. Confirmatory analysis with 3-factors solution and item allocation by factor.
Table 2. Confirmatory factor analysis standardized coefficient weights for 9-item scale.
Table 3. Association between parents features and factors “confidence” and “hesitancy”.
Table 4. Association between VCI and parents’ characteristics.
Table 5. Univariate logistic regression and multivariate logistic regression results between the intention to vaccinate (outcome, 1 = “willing to vaccinate”) and vaccine confidence index (VCI) and social media networks, internet and health institutions as main sources of information.