Figures & data
Table 1. Demographic characteristics of the study population.
Table 2. Geometric means and 95%CI of anti-S/RBD levels (AU/mL) at the three considered time points after second dose of vaccine; p-values refer to the comparison among groups at each measurement.
Figure 1. Measurements of anti-S/receptor binding domain (RBD) (by natural log transformed values and 95%CI) in the groups classified based on sex and age: (a) overall; (b) 20–44 years; (c) 45–55 years and (d) 56–85 years; p-values by Wilcoxon – Mann–Whitney test are shown for each post-vaccination time point.
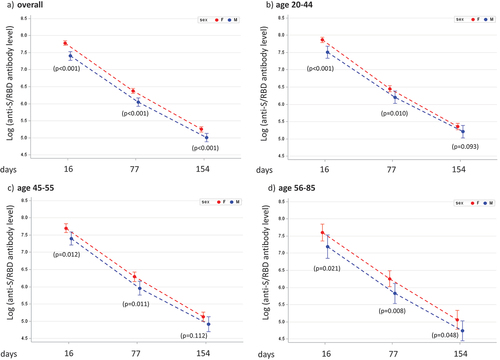
Figure 2. Analysis of sex differences in anti-S/RBD waning. Scatters for the log values of anti-S/RBD antibody levels with the regression lines estimated using mixed regression model for males (M) and females (F), panel (a) all age groups; panel (b) 20–44 years; panel (c) 45–55 years; panel (d) 56–85 years; p-values relative to anti-S/RBD antibody slope differences in M vs F are shown in each panel.
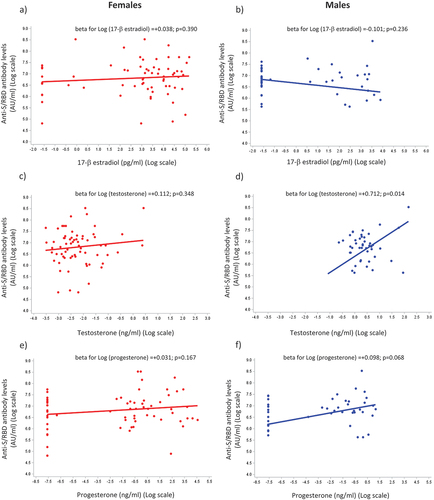
Figure 3. The effect of sex hormones on the anti-S/RBD response to vaccination. Simple regression models for anti-S/RBD antibody levels applied in a subgroup of healthcare workers (HCWs, n = 112) using the log of sex hormone plasma levels as a covariate; 17-β estradiol: a (females) and B (males); testosterone: C (females) and D (males); progesterone: E (females) and F (males); beta estimates (slopes) with relative p-values obtained using regression models are shown in each panel.