Figures & data
Figure 1. Flowchart of literature selection about “B cell and AS”.
Figure 2. The increasing tendency of the number of publications. (a) The annual number of publications. (b) The average citations per year. (c) Countries’ publications over time.
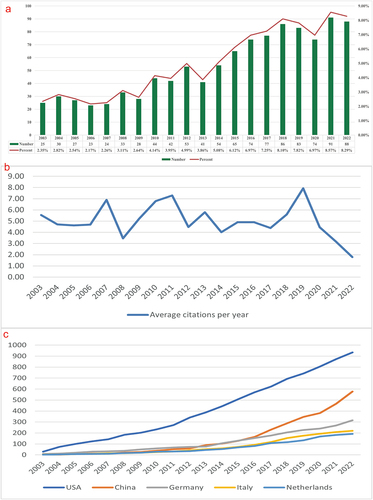
Table 1. Top 10 countries/regions and institutions about “B cell and AS”.
Figure 3. The visualization of countries/regions and co-cited institutions. (a) CiteSpace network analysis map of countries/regions. (b) VOSviewer network analysis map of countries/regions. (C) CiteSpace network analysis map of institutions. (d) VOSviewer network analysis map of institutions.
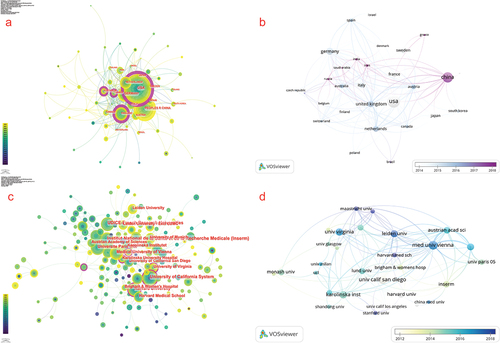
Figure 4. Major disciplines network analysis map by CiteSpace.
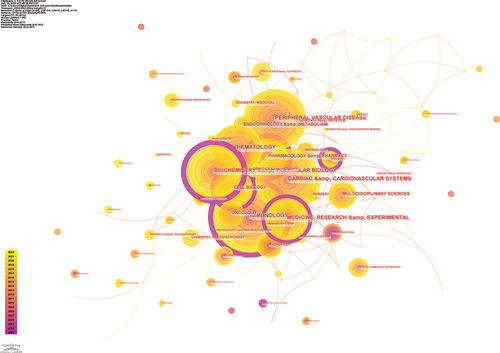
Table 2. Top 10 disciplines about “B cell and AS”.
Table 3. Top 10 authors, cited authors and co-cited authors about “B cell and AS”.
Figure 5. The visualization of authors and co-cited authors. (a) CiteSpace network analysis map of authors; (b) VOSviewer network analysis map of authors; (c) CiteSpace network analysis map of co-cited authors; (d) VOSviewer network analysis map of co-cited authors.
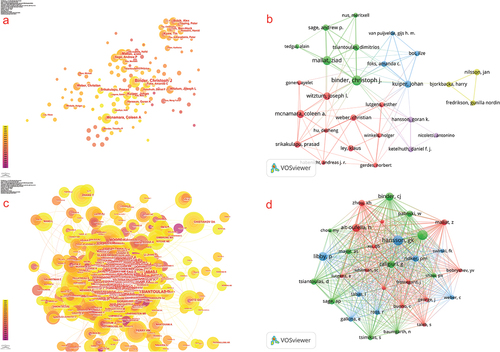
Table 4. Top 15 journals and co-cited journals about “B cell and AS”.
Figure 6. Network analysis map of journals. (a) The visualization of journals. (b) The visualization of co-cited journals.
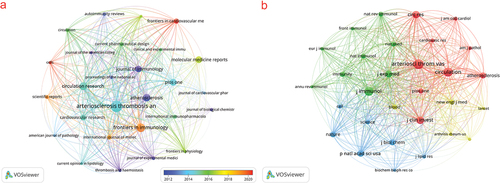
Figure 7. The dual-map overlay of journals about “B cell and AS”.
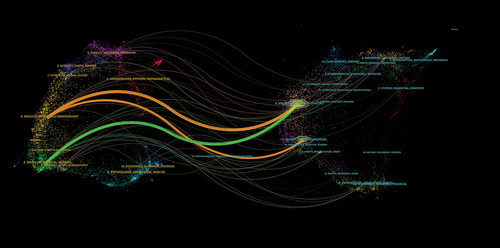
Table 5. Top 10 co-cited references about “B cell and AS”.
Figure 8. (a) The visualization map of co-cited references. (b) Top 25 references with the strongest citation bursts.
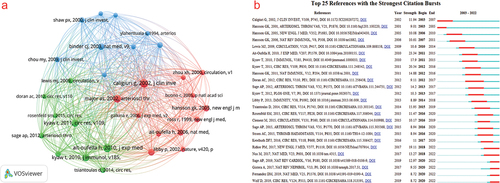
Table 6. The titles of the 25 references with the strongest citation bursts.
Table 7. Top 44 keywords on the research of “B cell and AS”.
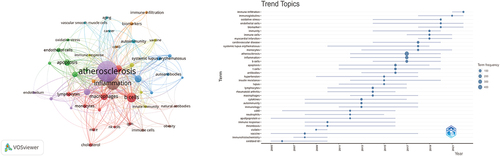
Figure 9. (a) The visualization of keyword analysis. (b) The visualization of trend topic analysis.