Figures & data
Figure 1. Antibody functionality assay. (a) FACS binding curves of RB49 (black) and xiRB49 (red). MAb specificity was assessed with CHO-ETB (solid line) and CHO-WT (dotted line). (b) Table of apparent Kd (nM) and Bmax (% MFI) for RB49 and xiRB49. Data are presented as mean ± SD.
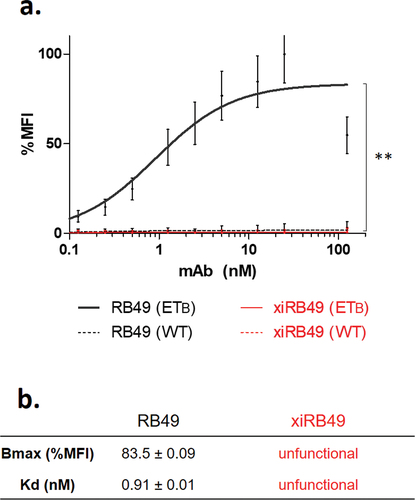
Figure 2. RB49 VH domain IMGT collier de perles representation. (a) All hydrophobic amino acids are in blue and amino acids conserved positions in all immunoglobulins in green. Squares represent the anchor positions which delimit the CDR-IMGT (framed in color, red CDR1, orange CDR2, purple CDR3) and framework IMGT (framed in black) regions. Hatched circles correspond to missing positions according to IMGT unique numbering for variable domain. The direction of the beta strands is represented by black arrows. Unusual proline is circled in green (b) proline and threonine chemical structures are presented.
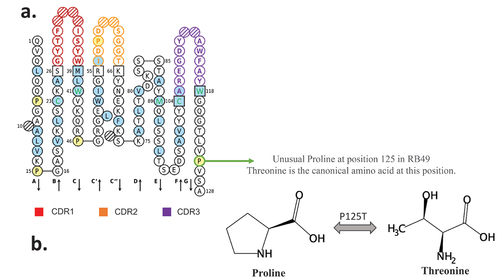
Figure 3. FACS binding curves of RB49 and xiRB49-P125T. (a) RB49 (black) and xiRB49-P125T (green) for CHO-ETB (solid line) and CHO-WT (dashed line). (b) Apparent Kd (nM) and Bmax (% MFI) are indicated in the table. Data are presented as mean ± SD. A two-tailed paired student’s t-test was used for data comparison.
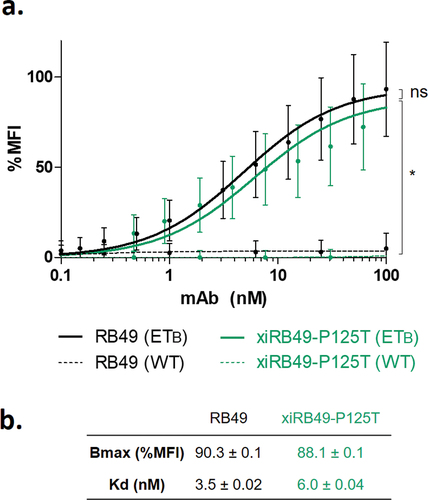
Figure 4. xiRB49 and xiRB49-P125T thermal denaturation curves. (a) Schematic representation of the denatured domain of an antibody as a function of the temperature. (b) First derivative (ratio A350 nm/A330 nm) curves as a function of temperature for xiRB49 (red) and xiRB49-P125T (green). Inflection temperature (Ti) (table). HC: heavy constant chain; Ti: inflection temperature.
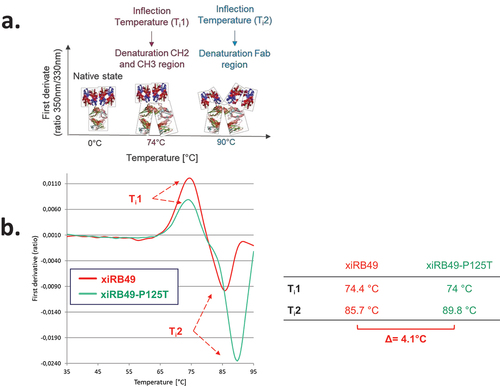
Figure 5. Binding and thermal denaturation experiments with xiRB49 and xiRB49-P125T Fab. (a) Bmax and Kd (table) of the Fab-xiRB49 (red), Fab-xiRB49-P125T (green) and xiRB49-P125T mAb (dark green). (b) First derivative (ratio A350 nm/A330 nm) curves as a function of temperature for Fab-xiRB49 (red), Fab-xiRB49-P125T (green), the xiRB49-P125T mAb (dark green) and their inflection temperature (Ti) (table).
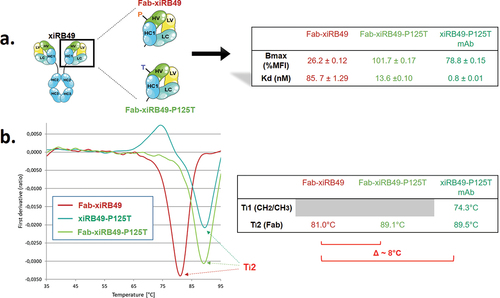
Figure 6. Average contact maps for (a) RB49 Fab, (b) xiRB49 Fab, and (c) xiRB49-P125T Fab. The contact maps were obtained by averaging over the three aMD runs performed for each system and by imposing a Cα distance threshold of 12 Å. The heavy and light chain CDRs are highlighted in red (CDR1), yellow (CDR2), and purple (CDR3). The numbering of amino acids does not correspond to the IMGT numbering, but follows the simulation package sequential numbering (heavy chain variable region: res. 1–118; heavy chain CH1: res. 119–220; light chain variable region: res. 221–332; light chain constant region: res. 333–440).
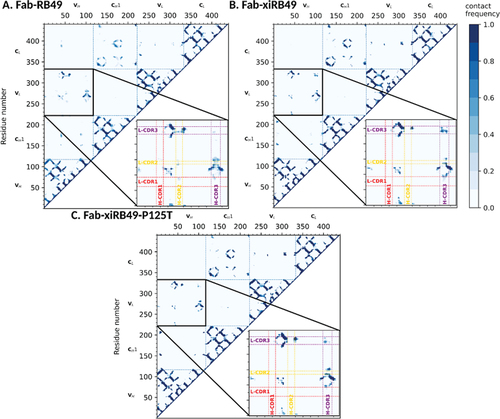
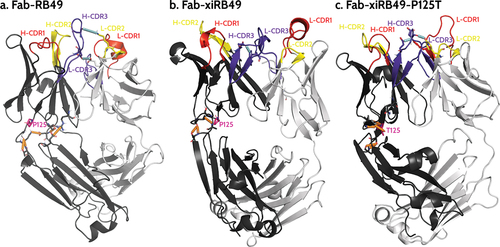
Figure 7. Representative structures of the most populated cluster of (a) Fab-RB49, (b) Fab-xiRB49, and (c) Fab-xiRB49-P125T. The heavy chain and the light chain are represented in dark and light gray, respectively. CDR1, CDR2, and CDR3 are colored red, yellow, and purple, respectively. The residue in position 125 (either proline or threonine) is represented as ball and sticks and colored magenta. The hydrogen bond network within the region between the heavy chain variable and constant regions is indicated as dotted orange lines, while the interactions involving the H- and L-CDRs mentioned in the manuscript are indicated as dotted cyan lines. The indicated hydrogen bonds come from the analysis of the 3 simulations for each system.