
Figures & data
Figure 1. Characterization of the immune response in Syrian golden hamsters after a primary series of mRNA and DNA vaccination delivered at different sites. (a) Study schematicCitation25 and dosing schedule in Syrian golden hamster. (b-c) Neutralizing activity (ID50 values) against the WT and BA.1 pseudoviruses are shown (ID delivery, b and IM delivery, c). Each data point represents the mean of technical duplicates for each animal (n = 6). Dashed lines represent the limit of detection (LOD) of the assay. Samples below LOD were plotted at the number equivalent to half of the lowest serum dilution. Data shown represent ID50 (GMT ± 95% CI) for each group of six hamsters. (d-e) Splenocyte cellular responses to WT and BA.1 spike peptide megapools measured by IFNγ ELISpot assay (ID delivery, e and IM delivery, f). Data shown represent IFNγ spots per one million cells of experimental triplicates (mean ± SEM) after DMSO subtraction. ****P ≤ .0001, **P = .0021, *P = .033 (2-way ANOVA, tukey’s multiple comparison).
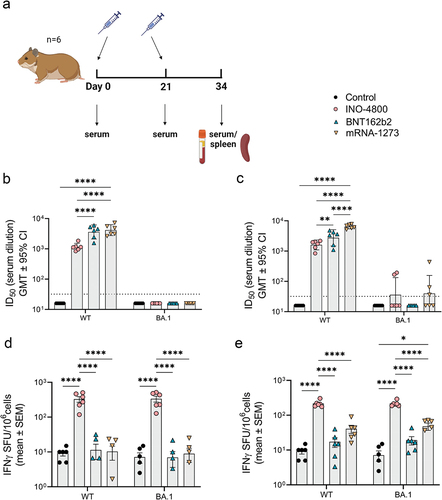
Figure 2. Heterologous and homologous boost of mRNA vaccinated hamsters. (a) Study schematicCitation25 and dosing schedule in Syrian golden hamsters. (b) Neutralizing activity (ID50 values) against the WT pseudovirus pre-boost (day 96) and post-boost (day 110) are shown. Each data point represents the mean of technical duplicates for each animal (n = 6). Dashed lines represent the limit of detection (LOD) of the assay. Samples below LOD were plotted at the number equivalent to half of the lowest serum dilution. Data shown represent mean ID50 (GMT ± 95% CI) for each group of six hamsters. GMT numbers are plotted above bars for reference. **P < .001. 2-way ANOVA, Sidak’s multiple comparison. (c) Splenocyte cellular responses to WT spike peptide megapool on day 110 measured by IFNγ ELISpot assay. Data shown represent IFNγ spots per one million cells of experimental triplicates (mean ± SEM) after DMSO subtraction. *P < .05 student t-test, Mann Whitney.
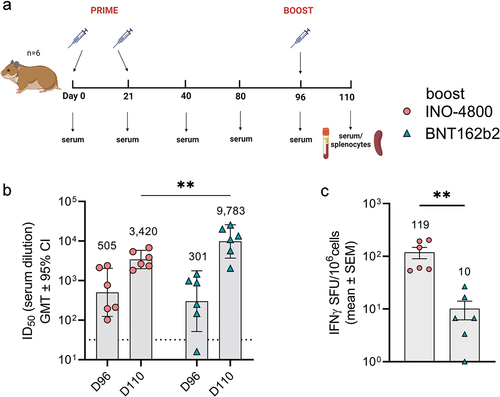
Figure 3. Characterization of the immune response in New Zealand rabbits after a primary series of mRNA and DNA clinically relevant doses. (a) Study schematicCitation25 and dosing schedule in New Zealand rabbits. (b) Neutralizing activity (ID50 values) against the WT pseudovirus for sera samples from Day 0, Day 14 and Day 35 are shown. Dashed lines represent the limit of detection (LOD) of the assay. Samples below LOD were plotted at the number equivalent to half of the lowest serum dilution. Data shown represent mean ID50 (GMT ± 95% CI) for each group of six rabbits. Numbers above bars represent GMT values and fold-change between treatments. (c-d) PBMC cellular responses to WT spike peptide megapool on (c) days 0, 14, 35 and 85 or (d) responses to WT, Beta, Delta, BA.1 and BA.2 variant spike megapools at Day 35 measured by IFNγ ELISpot assay. Numbers above bars represent fold-change between treatments for each variant. Data shown represent IFNγ spots per one million cells of experimental triplicates (mean ± SEM) after DMSO subtraction. (b-d) ****P < .0001, **P < .01, *P ≤ .05 (2-way ANOVA, sidak’s multiple comparison).
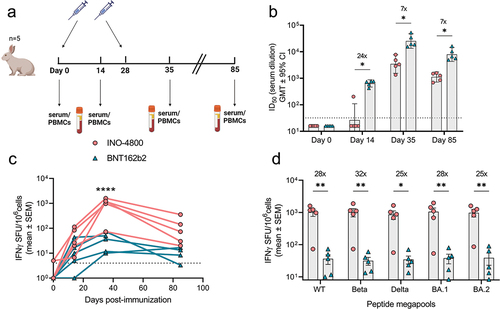
Figure 4. Cellular and humoral mechanisms involved in mRNA and DNA vaccination in C57BL6 mice. (a) Neutralizing activity (ID50 values) against the WT pseudovirus for sera samples from day 28 are shown. Dashed line represents the limit of detection (LOD) of the assay. Samples below LOD were plotted at the number equivalent to half of the lowest serum dilution. Bars represent mean ID50 (GMT ± 95% CI) for each group of eight mice. Numbers above bars represent the GMT. (b) Splenocyte cellular responses to WT spike peptide megapool at day 28, measured by IFNγ ELISpot assay. Bars represent the mean ± SEM of experimental triplicates shown as IFNγ spots per million cells after DMSO subtraction. Frequency of (c) Tfh, (d) activated Tfh, (e) GC B and (f) spike-specific GC B cells from spleens of vaccinated mice on day 28 is shown. To assess frequency of Tfh cells and activated Tfh and CD4 T cells, splenocytes were stained with CD4, CD3, CXCR5, PD-1, live-dead; CD25, and ICOS antibodies. To assess frequency of GC B and spike-specific GC B cells, splenocytes were stained with live-dead staining, biotinylated spike-tetramers, CD3, B220, GL7 and CD95 antibodies for a flow cytometric analysis. ****P < .0001, ***P < .001, **P < .01, *P ≤ .05 (Kruskal Wallis test).
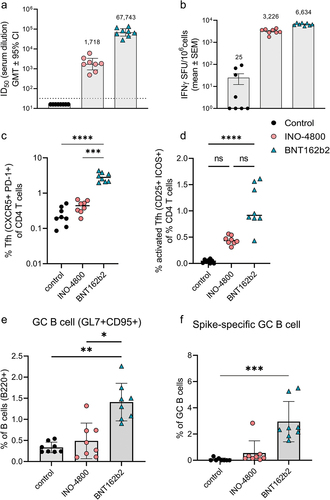
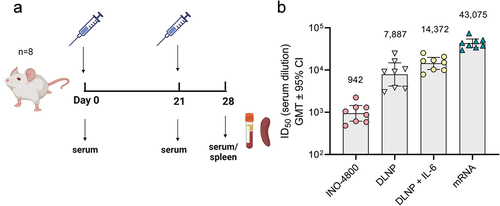
Figure 5. Evaluation of humoral immune response enhancements in BALB/c mice. (a) Study schematicCitation25 and dosing regimen in BALB/c. (b) Neutralizing activity (ID50 values) against the WT pseudovirus for sera samples from day 28 are shown. Data shown represent mean ID50 (GMT ± 95% CI) for each group of eight mice. GMT values are plotted above bars for reference.
Supplementary figure 3_Andrade et al_Oct17 2023.tif
Download TIFF Image (1.7 MB)Supplementary figure 1_Andrade et al_Oct17 2023.tif
Download TIFF Image (477.6 KB)Supplementary figure 2_Andrade et al_Oct17 2023.tif
Download TIFF Image (326.7 KB)Data availability statement
All data generated in this study have been presented in this manuscript and supplementary figures and no additional data are available.