
Figures & data
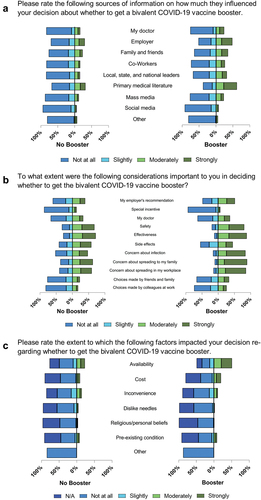
Figure 1. Responses to questions about how factors influenced vaccination decisions, stratified by whether participants had received the COVID-19 bivalent booster, project PREVENT, October 2022–April 2023. Each bar displays the proportion of responses in each likert category. All bars are indexed to “moderately agree” (e.g., that is where the vertical line is on the graph), so the total length of the bar denotes 100% of responses. The panel on the left shows responses from those who had not received the bivalent booster, while the panel on the right shows responses from those who had received the bivalent booster.
Supplemental material