
Figures & data
Table 1. Demographics of collected responses (n = 151).
Table 2. Respondent COVID-19, influenza, childhood and adolescent vaccine uptake (n = 151).
Figure 1. Respondents’ attitudes toward willingness to receive vaccines. a) Number of responses recorded for willingness to consent to COVID-19 vaccine after pooling responses. b) Number of responses recorded for willingness to consent to any vaccine after pooling responses. Classification was performed post-hoc as described. Percentages displayed over the bars are the total percent of the responses categorized as vaccine acceptors, vaccine hesitants, and vaccine resistants.
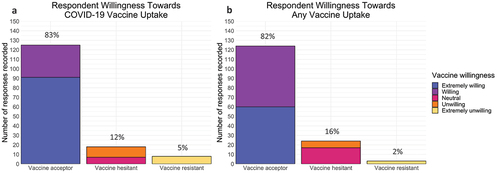
Figure 2. The frequency of exposure to vaccine advocacy messaging or vaccine misinformation or disinformation within each willingness group. Respondent exposure to (a) vaccine advocacy messaging and (b) vaccine misinformation or disinformation and their willingness to receive a COVID-19 vaccine. Respondent exposure to (c) vaccine advocacy messaging and (d) misinformation and disinformation and their willingness to receive any vaccine. N = number of respondents in group.
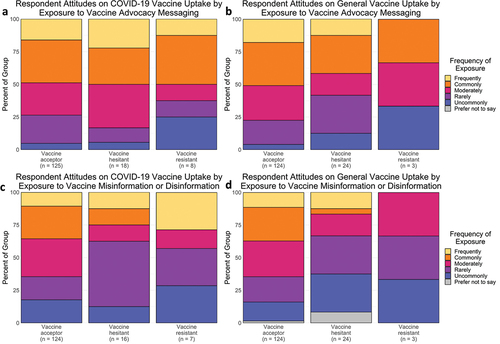
Figure 3. Frequency of respondents’ social media habits and their willingness to be vaccinated. a) Respondents’ attitudes toward the COVID-19 vaccine and their main social media platform. b) Respondents’ willingness to be vaccinated toward any vaccine and their main social media platform. c) Respondents’ attitudes toward the COVID-19 vaccine and their willingness to continue to follow a social media account with alternative vaccination beliefs. (d) Respondents’ attitudes toward general vaccines and their behavior toward alternative vaccination beliefs. N = number of respondents in group.
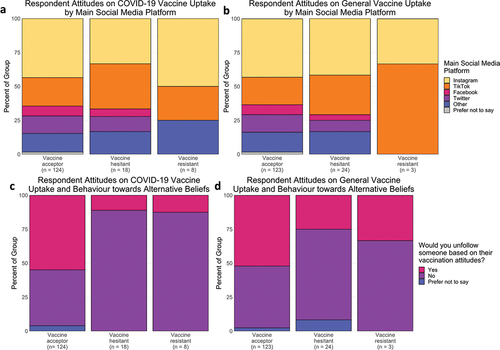
Figure 4. Proportion of respondents’ interaction with live news broadcasts, their main source of news outside of TV or news broadcasts and their attitudes toward vaccines. a) Respondent live TV news broadcast interaction and their feelings toward the COVID-19 vaccines. b) Respondent live TV news broadcast interaction and their feelings toward general vaccines. c) Respondent live radio news broadcast interaction and their feelings toward the COVID-19 vaccines. d) Respondent live radio news broadcast interaction and their feelings toward general vaccines. e) Respondent attitudes toward the COVID-19 vaccine and their main source of news if they do not watch or listen to live broadcasts. f) Respondent attitudes toward general vaccines and their main source of news if they do not watch or listen to live broadcasts. N = number of respondents in group.
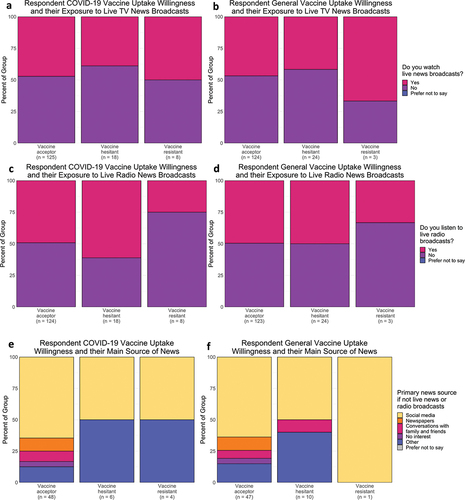
Figure 5. Proportion of respondents’ accommodation type and their attitudes toward vaccines. a) Respondents’ attitudes toward COVID-19 vaccines and their accommodation while living at UCC. b) Respondents’ attitudes toward general vaccines and their accommodation while living at UCC. N = number of respondents in group.
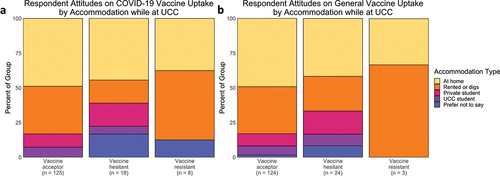
Figure 6. Proportion of respondents’ yearly influenza vaccination uptake and their behavior toward influenza vaccinations. a) Respondent influenza vaccine uptake and their willingness to accept a COVID-19 vaccine. b) Respondent yearly influenza vaccine uptake and their willingness to accept a general vaccine. N = number of respondents in group.
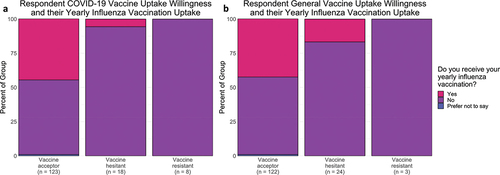
Table 3. Frequency of reasons either for or against receiving any vaccination. Respondents were allowed to select multiple options (n = 151).
Table 4. Results of Chi-squared tests performed for the question “what is your willingness to be vaccinated with any vaccine?” or “what is your willingness to be vaccinated with the COVID-19 vaccines?” performed prior to post-hoc grouping. p-values <.05 were considered statistically significant. ‘*’ = p < .05, ‘**’ = p < .01, ‘***’ = p < .001.