
Figures & data
Figure 1. Number of daily SARS-CoV-2 vaccinations and the division of the five periods. The solid blue line shows the number of daily vaccinations in Beijing from October 12, 2022 to May 12, 2023, green arrows and font show policy changes, and red font shows the epidemic trend. The gray boxes mark the five periods chosen for the study. The Spring festival (from January 21 to 27, 2023) and May Day holidays (from April 29, to May 3, 2023) were excluded. COVID-19, coronavirus disease 2019; SARS-CoV-2, severe acute respiratory syndrome coronavirus 2.
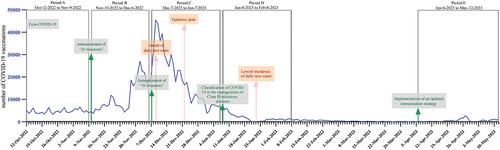
Table 1. Implementation of SARS-CoV-2 vaccination services in different areas of Beijing.
Figure 2. Accessibility and capacity of vaccination services in Beijing. Panel a describes the distribution of vaccination sites and the results of hot spot analysis; panel b describes the results of average nearest neighbor analysis; and panel c describes the results of Ripley’s K function analysis.
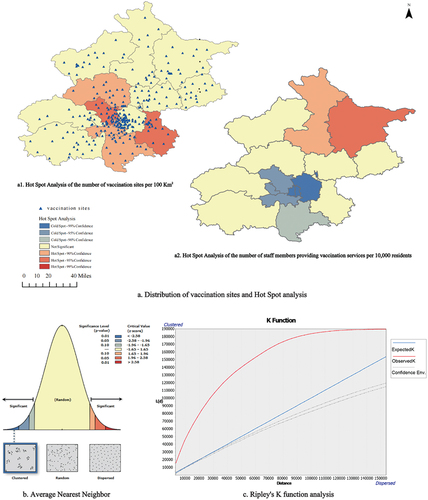
Figure 3. Real demand for vaccination in different areas in Beijing during the selected three periods. Period B: the period at the beginning of the epidemic when the daily doses of vaccines increased; period C: the period of the vaccination and epidemic peak; period E: the period at the later phase of the epidemic when the daily doses of vaccines decreased.
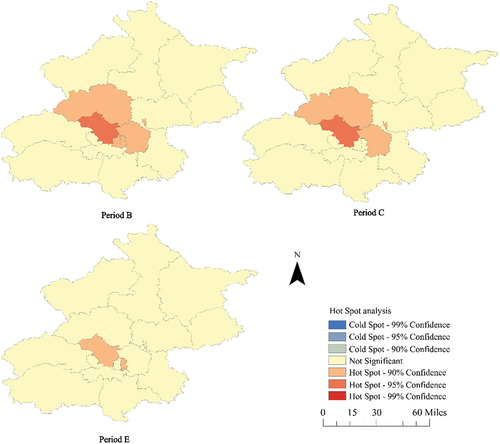
Table 2. Univariate and multivariate analysis of interventions to promote SARS-CoV-2 vaccination.
Additional_files_2_clean.docx
Download MS Word (16.2 KB)Additional_files_1.doc
Download MS Word (98 KB)Data availability statement
The datasets used and/or analyzed during the current study are available from the corresponding author, [Li], upon reasonable request.