
Figures & data
Figure 1. Dose-dependent survival after challenge. a. Kaplan–Meier curves representing time to death and survival data for each group vaccinated with AV7909. b. fitted logistic model for survival in the groups of vaccinated animals as a function of dilution factor and vaccine (parallel slope) overlaid on the observed data.
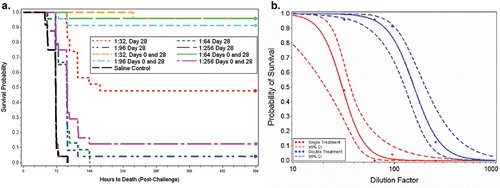
Table 1. Proportion of surviving animals with Clopper-Pearson 95% confidence intervals by group and results of Boschloo’s exact test comparing survival in each vaccinated group to the control group.
Figure 2. Immune correlates of protection a. geometric means and 95% confidence intervals for anti-PA IgG ELISA concentration (µg/ml). b. logistic regression model fitted to survival as a function of log-transformed anti-PA IgG ELISA concentration for vaccinated groups with a fixed effect for vaccine dose group on study day 69. c. group geometric means and 95% confidence intervals TNA NF50. d. fitted logistic regression model for survival in the vaccinated groups as a function of log10 TNA NF50 on study day 69.
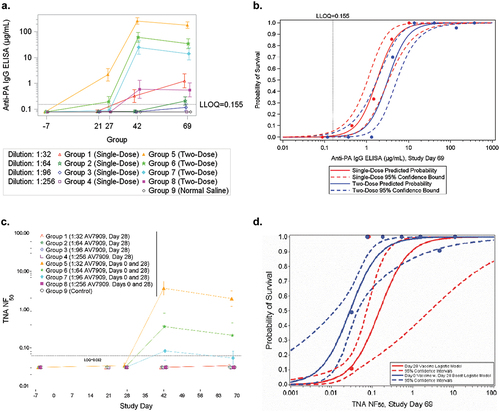
Table 2. Estimated anti-PA IgG concentration (µg/mL), as measured by ELISA, with 95% confidence intervals for vaccinated groups by survival probability.
Table 3. Estimated TNA NF50 with 95% confidence intervals for vaccinated groups by survival probability.