Figures & data
Table 1. Websites for epitope prediction.
Table 2. In silico analysis of CT23 epitopes restricted to HLA-A*0201.
Figure 1. Affinity and stability of CT23 candidate peptides binding to HLA-A2 analyzed by flow cytometry.
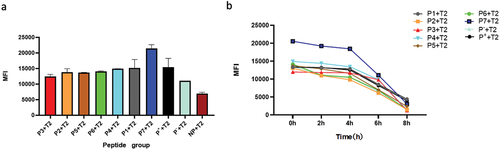
Table 3. The HLA-A2 binding affinity and stability of CT23 candidate peptides and control peptides.
Figure 2. Expression of CT23 protein in tumor cells detected by immunoblot.
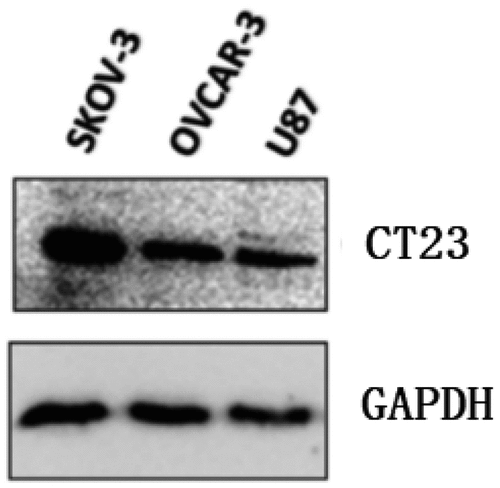
Figure 3. Morphological features of DCs in different stages.
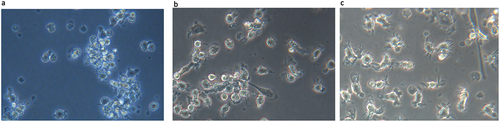
Figure 4. The surface molecules of DCs detected by flow cytometry.
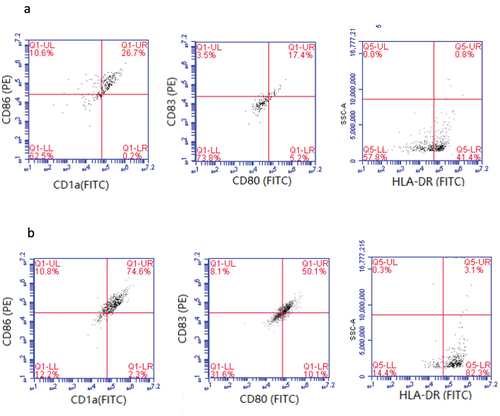
Figure 5. Proliferation assay of D8+T cell stimulated by peptide-loaded DCs.
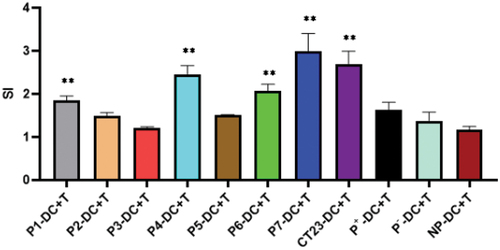
Figure 6. IFN-γ production ability of CT23 peptide-induced CTLs.
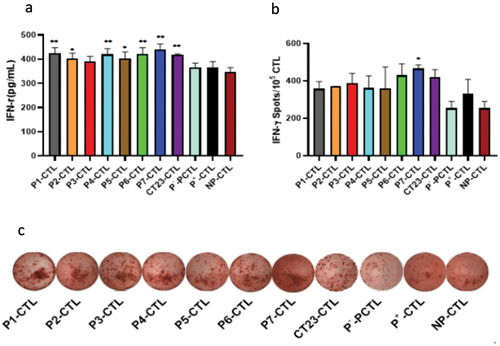
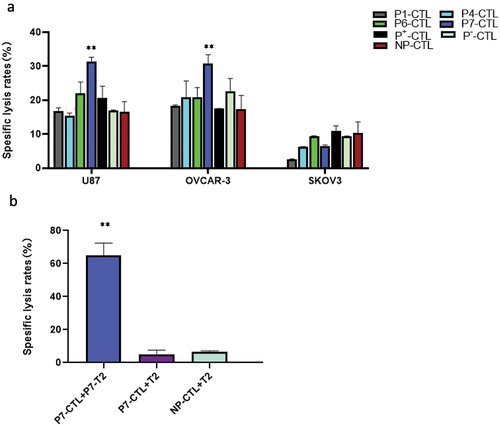
Figure 7. Cytotoxic activity of CT23 peptide-induced CTLs to target cells detected by LDH release.