Figures & data
Figure 1. Graphical abstract.
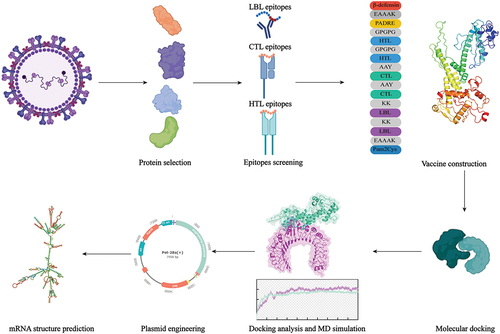
Table 1. Screen of CTL epitopes.
Table 2. Screen of HTL epitopes.
Table 3. Screen of LBL epitopes.
Figure 2. Prediction of secondary structure of vaccine.
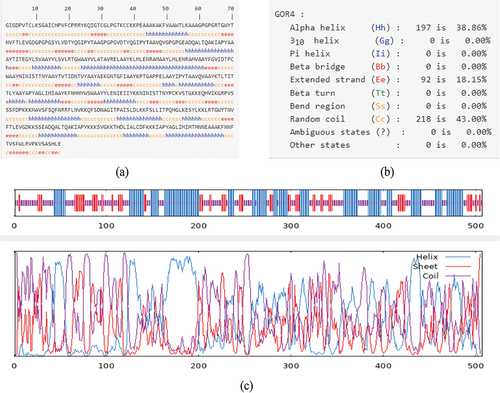
Figure 3. Construction of multi-epitope vaccine.
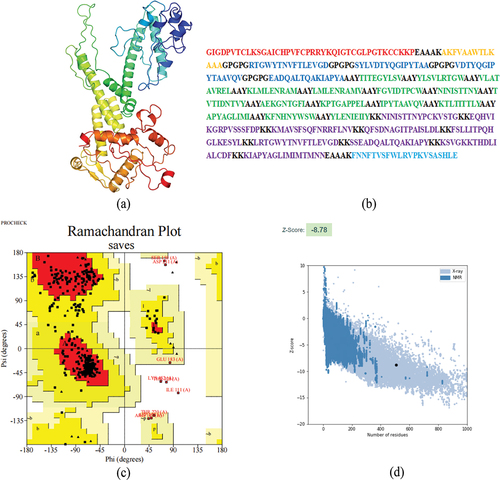
Figure 4. Docking analysis of vaccine-TLR2 complex, the docking result is on the left, and the analysis of the interactions inside the complex are on the right.
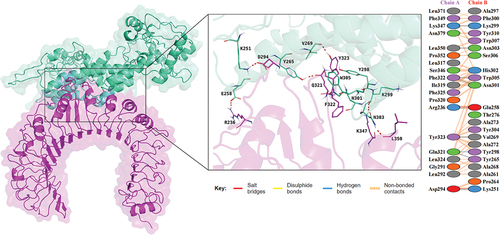
Figure 5. Docking analysis of vaccine-TLR4 complex, the docking result is on the left, and the analysis of the interactions inside the complex are on the right.
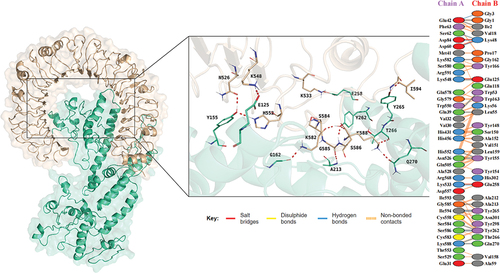
Table 4. Docking analysis of vaccine–TLR combination.
Figure 6. The results of molecular dynamics simulation.
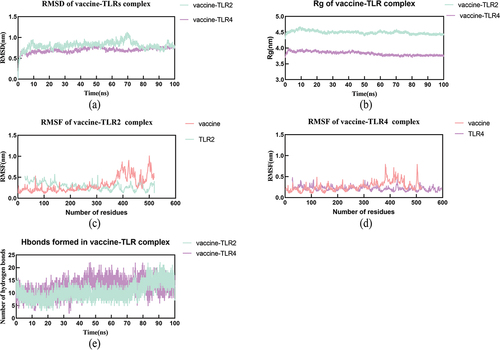
Table 5. MMPBSA of vaccine-TLR2/TLR4 delta (complex - receptor - ligand).
Figure 7. Immune simulation after 3 doses of vaccination.
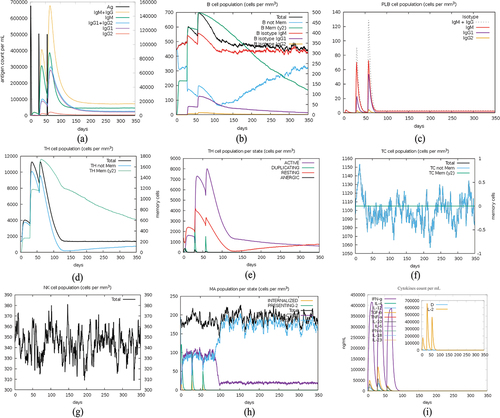
Figure 8. Population coverage of the vaccine.
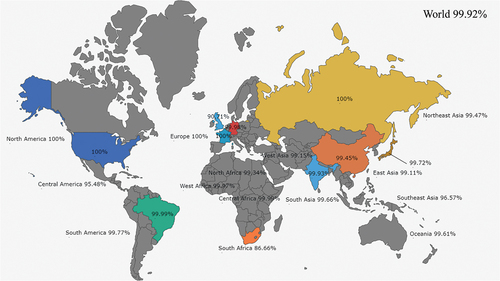
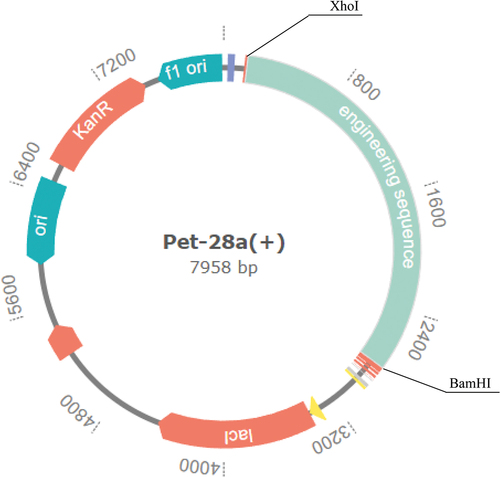
Figure 9. In silico cloning of codon-optimized vaccine into E. coli K12’s expression system.