
Figures & data
Table 1. Demographic and epidemiological information of 272 subjects (235 returning Chinese individuals, 37 foreigners).
Table 2. SARS-CoV-2 N and S proteins and neutralizing antibodies by ELISA.
Figure 1. NAb titers of participants with (a) primary, (b) homologous booster and (c) heterologous booster vaccination against the prototype virus and a variety of omicron variants of concern (VOCs).
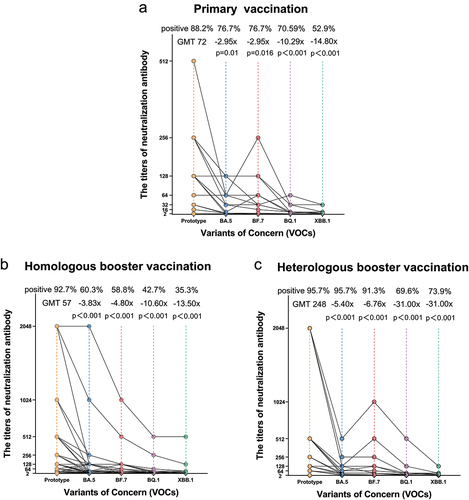
Figure 2. SARS-CoV-2-specific memory T-cell (MTC) responses in participants (N = 33) with primary, homologous booster and heterologous booster vaccination. (a) Number of specific IFN-γ-secreting T cells. (b) Number of specific IL-2-secreting T cells. (c) The spots from sample 93.
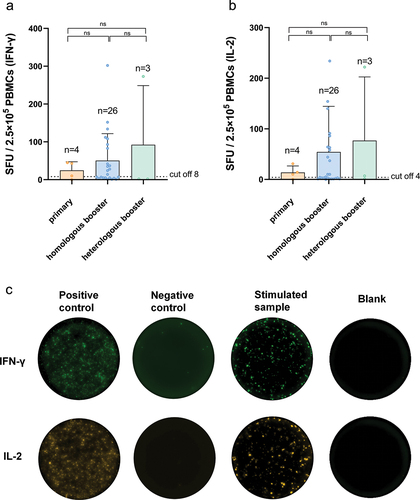
Table 3. Univariate analysis of factors related to NAb titers for SARS-CoV-2.