
Figures & data
Table 1. IMD case definition and type of surveillance across the included countries.
Table 2. Diagnostic methods across the included countries.
Figure 1. Average notification rates for IMD across the included countries for the period 2010 to 2019.
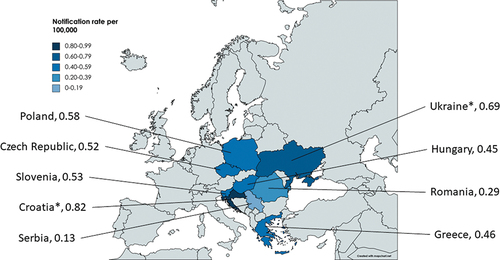
Table 3. Notification rates (confirmed cases) per 100,000 population across the included countries, 2010 to 2020.
Figure 2. Age standardized rates of IMD per 100,000 population across included countries for 2019.Citation26.
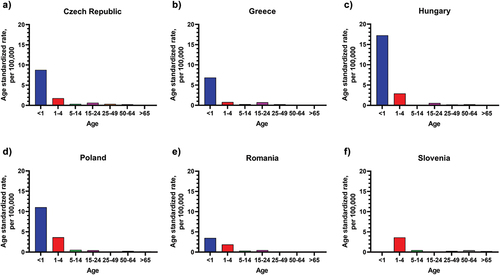
Table 4. Number of deaths and case fatality rates across the included countries, n deaths (CFR %) 2010 to 2020.
Figure 3. Number of reported cases by serogroups, 2010 to 2020 in selected age groups, as indicated in Table S1.Citation26.
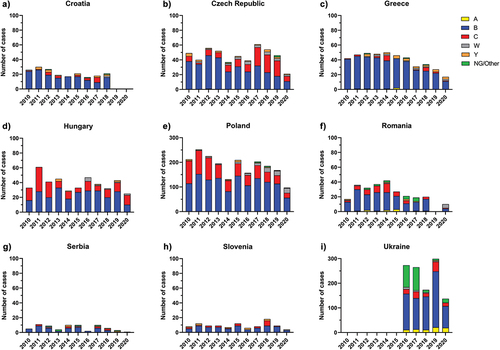
Table 5. Meningococcal vaccination strategies and recommendations for each included country.
Supplementary Materials revised_clean_.docx
Download MS Word (40.7 KB)Data Availability Statement
The data that support the findings of this study are included in the study/or can be requested from the corresponding author upon reasonable request.