Figures & data
Figure 1. Freeze thaw (F/T) induced rNA conformational changes that impact physiochemical properties and functional activities. The rNA in NaPBS was subjected to 1, 3 and 5 F/T cycles and the impact was assessed by SEC, extrinsic fluorescence, and Tamiflu binding. (a) SEC profiles show a change from ‘closed’ to ‘open’ tetramer conformation after F/T stress. Changes in physiochemical properties were also observed in terms of (b) % Closed tetramer by SEC (n = 2), (c) Reduction in melting temperature Tm (n = 2) and (d) Reduced functional activity in terms of Tamiflu-binding (n = 3).
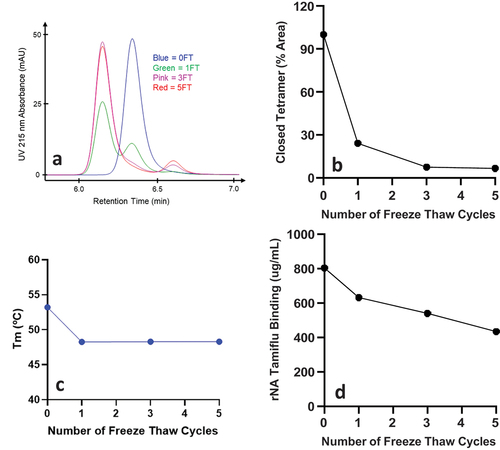
Figure 2. HDX-MS data of 5X FT rNA in NaPBS buffer mapped onto three-dimensional structure. Highlighted region (red) represents peptides that showed increase in deuterium uptake and is also known as the 150 loop which undergoes conformational change during substrate binding.
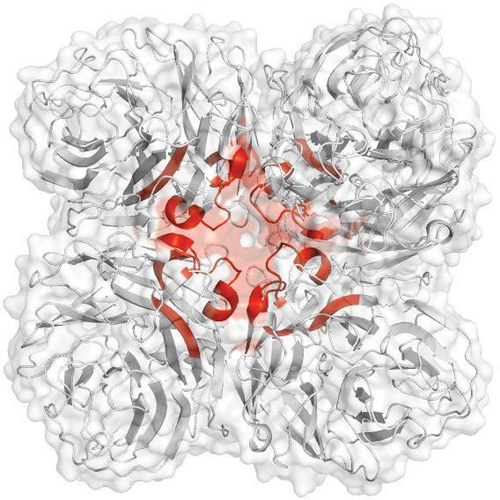
Figure 3. The freeze thaw-induced rNA conformational change is abolished when switching from NaPBS to KP buffer. The rNA in either KP buffer pH 7.4 or NaPBS pH 7.0 underwent 5X F/T cycles and (a) % Closed tetramer (n = 2), (b) Melting temperature Tm (n = 2), and (c) Tamiflu Binding (n = 4) were measured. Error bars represent the standard deviation from the mean.
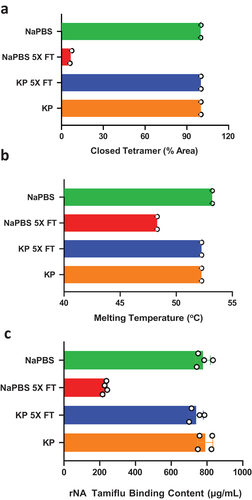
Figure 4. Acidic pH is necessary but not sufficient to trigger conformational change and closed tetramer is stabilized in KP-10% sucrose. Four rNA formulations in different buffers were analyzed (vertical axis). The % closed tetramer by SEC was monitored at ambient temperature, before (red bars) and after (blue bars) a single F/T cycle. Closed tetramer loss occurred following F/T in NaPBS pH 7.0 and monoNaPS pH 4.6. Tetramer was conserved in formulations with 10% sucrose.
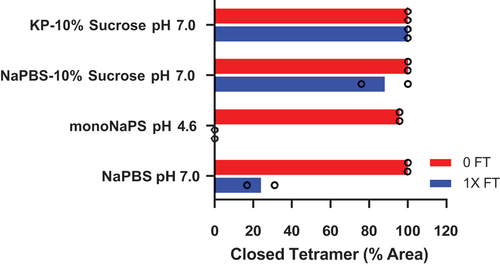
Figure 5. Antigenicity and % closed tetramer are potential critical quality attributes (pCQAs). Accelerated stability studies were initiated using rNA in KP-10% sucrose buffer. Samples from 3 months timepoint at 5°C and 37°C incubation and 1 week at 45°C were tested for (a) % closed tetramer by SEC (n = 2), (b) Tamiflu-binding (n = 1), (c) Antigenicity by ELISA (n = 2), and (d) immunogenicity, with symbols indicating NAI titer of individual animals, bars represent geometric mean titer (GMT) with 95% CI of 5–6 animals/group (* p < 0.05, Tukey’s multiple comparison test). All measurements decreased with increasing temperature and % closed tetramer by SEC and antigenicity by ELISA were considered pCQAs.
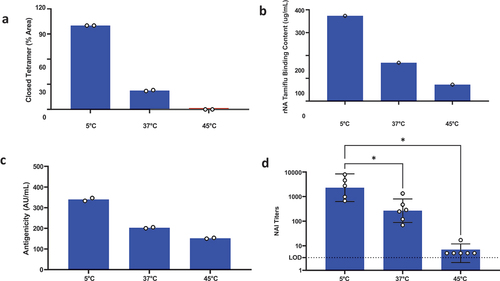
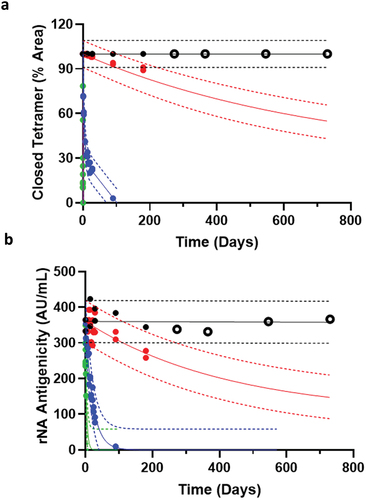
Figure 6. The rNA vaccine in KP-10% sucrose is predicted and verified to be stable for at least 24 months at 2–8°C. AKTS prediction software used 6 months accelerated stability data for (a) % Closed tetramer by SEC and (b) Antigenicity by ELISA to predict rNA stability for at least 24 months at 2–8°C. Stability data points up to 6 months were used for prediction, marked as filled circles from 5°C (black), 25°C (red), 37°C (blue), and 45°C (green). Solid line is the prediction mean; broken lines are the upper and lower 95% prediction intervals (PI). Real time data at 5°C on day 270 (9 M), 365 (12 M), 540 (18 M), and 730 (24 M) are bold open circles, showing no significant upward or downward trend, aligning with the prediction mean, and well within the PI for both assays.