
Figures & data
Figure 1. Flowchart describing cases and controls included in the study.
IPD, invasive pneumococcal disease; NV/NRT, non-vaccine/non-vaccine-related serotypes; Tdap, tetanus, diphtheria, and acellular pertussis vaccine.
Of the 254 IPD cases identified, 134 were eligible. Among them, 7 individuals were excluded (three had parents who received their Tdap <2 years preceding their pregnancy and for four persons, we were unable to ascertain maternal vaccination status). Of the 127 IPD patients, 37 were considered cases: four serotype 19F and thirty-three serotype 19A IPD.
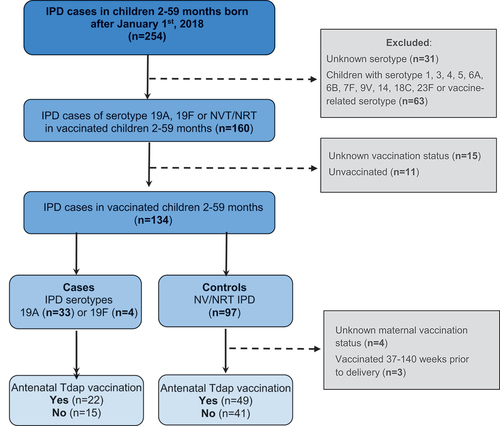
Table 1. Summary of sociodemographic variables collected for all IPD patients.
Data availability statement
Due to the nature of the research and to ethnical and legal restrictions, supporting data is not available.