Figures & data
Figure 1. Development and testing of human ESR1 targeting vaccines. (a) Diagram of E1 region for [E1-,E3-] adenoviral ESR1 vaccines. (b,c) C57BL/6J mice (b) and HLA-A2-Tg (c) were vaccinated with indicated viruses and assessed for ESR1-specific T cell responses at 2 weeks post vaccination through IFNγ ELISPOT (n = 5 mice/group). (d) HLA-A2 tg mice were vaccinated with the indicated viruses and assessed for ESR1-specific T cell responses at 2 weeks post vaccination through IFNγ ELISPOT (n = 3–4 mice/group). Error bars represent SEM. Select p values shown. Significance determined via T test with Bonferroni correction for multiple comparisons. ****p < .0001.
![Figure 1. Development and testing of human ESR1 targeting vaccines. (a) Diagram of E1 region for [E1-,E3-] adenoviral ESR1 vaccines. (b,c) C57BL/6J mice (b) and HLA-A2-Tg (c) were vaccinated with indicated viruses and assessed for ESR1-specific T cell responses at 2 weeks post vaccination through IFNγ ELISPOT (n = 5 mice/group). (d) HLA-A2 tg mice were vaccinated with the indicated viruses and assessed for ESR1-specific T cell responses at 2 weeks post vaccination through IFNγ ELISPOT (n = 3–4 mice/group). Error bars represent SEM. Select p values shown. Significance determined via T test with Bonferroni correction for multiple comparisons. ****p < .0001.](/cms/asset/357a2062-d8e8-4461-84cc-364b0224e987/khvi_a_2309693_f0001_oc.jpg)
Figure 2. Development of ERmut+ mouse mammary tumor model. (a) MM3MG cell lines expressing Y537N or Y537S doxycycline inducible ESR1 mutants were assessed at 24 hours post-dox/estrogen stimulation for the indicated pathway (n = 3/group). (b) QRT-PCR assessment of ESR1 expression in MM3MG lines. (c) Indicated MM3MG cells were implanted into BALB/c mice and allowed to grow, measured bi-weekly (n = 5 mice/group). (d) Indicated MM3MG cells were implanted into BALB/c mice and allowed to grow, measured bi-weekly (n = 5 mice/group).
Figure 3. Anti-tumor impact of ESR1mut vaccines in a ERmut+ mouse mammary tumor model. (a) BALB/c mice were vaccinated with indicated virus and MM3MG-ESR1-Y537N cells were implanted two weeks post-vaccination and tumor growth measured biweekly. (b) spleens from mice in (a) were assessed by IFNγ ELISPOT assay (n = 5 mice/group). (c,d) BALB/c mice were implanted with MM3MG-ESR1-Y537N (c) or MM3MG-ESR1-Y537N-CD90.1 (d) expressing cells and vaccinated the following day with tumor growth measured bi-weekly (n = 5 mice/group). (e) Tumors from (d) were removed and CD90.1 expression was measured ex vivo as a surrogate of ESR1 expression. Shown as % of expression seen in control treated cells. Error bars represent SEM. *p < .05; **p < .05; ***p < .001. (f,g) Representative images and analysis (g) of MM3MG-ESR1-Y537N-CD90.1/ERE-Luc tumors vaccinated with ad-GFP control or ad-ESR1-Y537N as in (c,d).
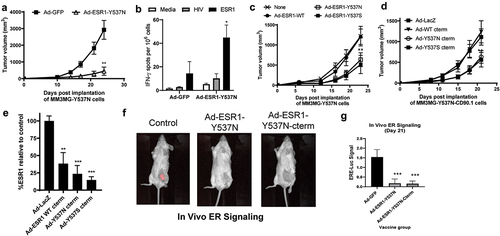
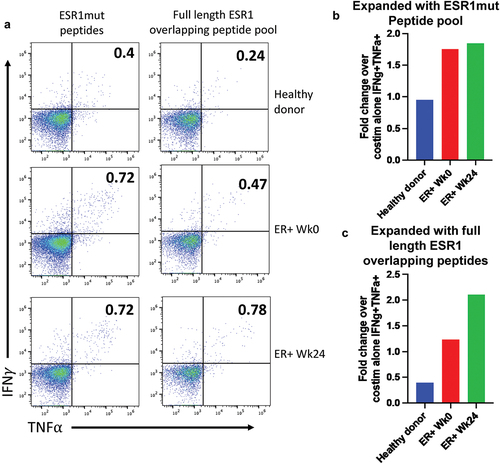
Figure 4. Expansion of ESR1-reactive human T cells. (a) PBMCs from a healthy donor and a patient enrolled in NCT04270149 at week 0 and week 24 after completing 6 vaccinations. Cells were expanded in vitro for 9 days with the vaccine containing ESR1mut peptides (left) or an overlapping peptide pool that encompassed the entire ESR1 protein (right). Cells were then restimulated, stained, and analyzed by spectral flow cytometry for IFNg and TNFa. Cells shown are pregated on live, singlets, CD3+, CD4–, CD8+, CD45RA–, CD45RO+. (b,c) the fold change in expression percent of ESR1mut peptides (b) or full length ESR1 (c) compared to a negative control that received costimulation but no peptide is shown for each sample.