
Figures & data
Table 1. Geometric mean ratios (GMR) with variable coating concentrations.
Table 2. Results from assay robustness design of experiments.
Table 3. Specificity assessment of the 6-plex GBS IgG dLIA using an immunized serum reference pool.
Table 4. Assay range based on standard curve bias, dilutional linearity and precision.
Figure 1. Dynamic ranges of the reference standard curves for the 6-plex GBS IgG dLIA. The reference standard serum dilution profiles for each of the 6 GBS CPS serotypes are shown: (a) Ia, (b) Ib, (c) II, (d) III, (e) IV, and (f) V. Median fluorescence intensity (MFI) signals for the reference standard curves are on the y axis, and specific IgG concentrations (µg/mL) are on the x-axis. The vertical dotted lines indicate the lower and upper assay limits determined from the validation study. Error bars represent the standard deviation from independent reference standard curves (n = 3).
Table 5. Final assay range and lower limit of quantitation (dilution adjusted).
Table 6. Intermediate assay precision.
Figure 2. Proficiency panel performance in the 6-plex GBS IgG dLIA. A proficiency panel with IgG concentrations ranging from low to high was evaluated post-assay validation, quarterly, for >1 year. Each panel shows the reported IgG concentrations (µg/mL; y-axis) across the quarterly timepoints tested (x-axis) for the following GBS serotypes: (a) Ia, (b) Ib, (c) II, (d) III, (e) IV, and (f) V. The geometric mean concentration with 95% CI is shown within a given time point and each black dot represents a proficiency panel sample. Of note, while 44 samples were used for the proficiency panel for all six serotypes, not every sample yielded a reportable result for every serotype. Therefore, the designated samples that constitute each of the six serotypes’ proficiency panel were slightly variable but lie between 41–44 samples.
Figure 3. Microsphere stability for the 6-plex GBS IgG dLIA. The geometric mean (GM) IgG concentration (y-axis) for two independently prepared microsphere lots (red circles, lot A; blue squares, lot B) across 12 months (x-axis) were tested by two laboratory analysts. Each panel depicts stability of the CPS PLL-coated microspheres for the following GBS serotypes: (a) Ia, (b) Ib, (c) II, (d) III, (e) IV, and (f) V. In each panel, the predicted line (black line) represents the linear regression line (or the line of best fit) for all bead lots (A and B) recorded over the 12-month period with 95% confidence intervals shown as the dashed lines.
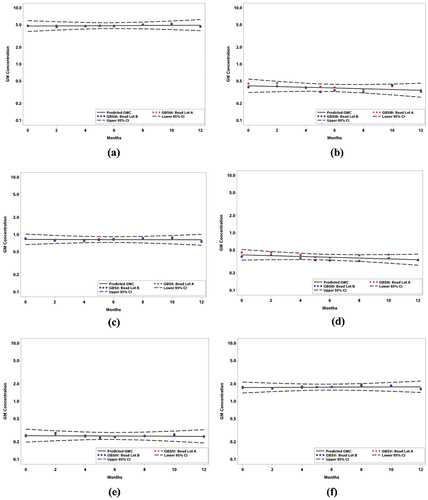
Table A1 Comparison of the 6-plex GBS IgG dLIA run as multiplex versus single plex.
Data availability statement
All raw and processed data files are available upon request to the corresponding author. The data are not publicly available due to privacy restrictions.