
Figures & data
Figure 1. Bar graph showing HPV vaccine status among US adults 27–45 year old, with ≥ 1 dose ever received, by race and ethnicity (p < .05).
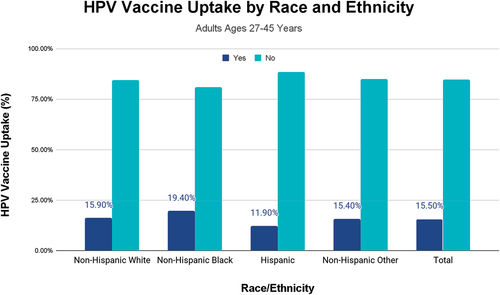
Table 1. Characteristics of study sample.
Table 2. Factors associated with uptake of HPV vaccine among 27–45 year olds based on race and ethnicity, and other sociodemographic factors.