
Figures & data
Figure 1. Flow chart for search strategy of publications.
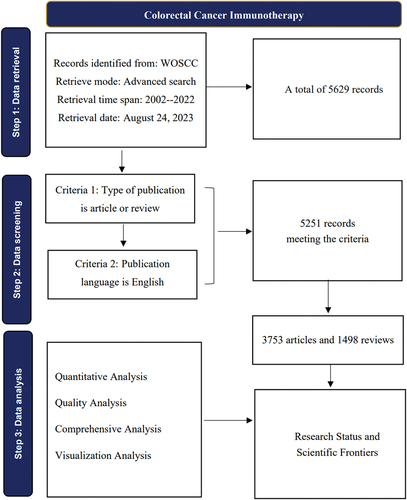
Figure 2. The annual growth trends of publication during the period 2002–2022.
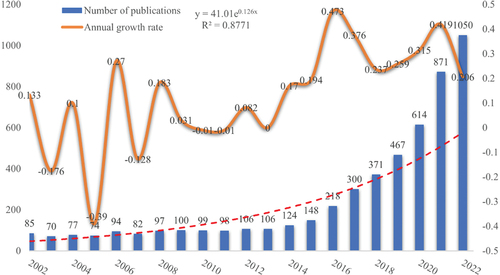
Figure 3. (a) Country/region number of publications. (b) Worldwide visualization map of publication collaborations. (c) Cooperation network among top 20 countries/regions based on quantity of publications. (d) Visualization of institutions with publications concerning colorectal cancer immunotherapy.
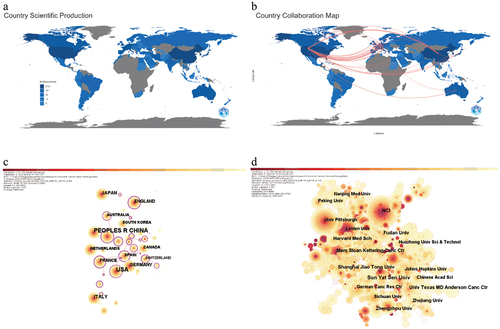
Table 1. Top 20 active countries/regions.
Table 2. Top 20 active institutions.
Figure 4. Visualization analysis of author collaborations (a) and author co-citations (b) generated by VOSviewer. Co-occurrence network diagram of journals (c) and co-cited network diagram of journals (d) generated by VOSviewer.
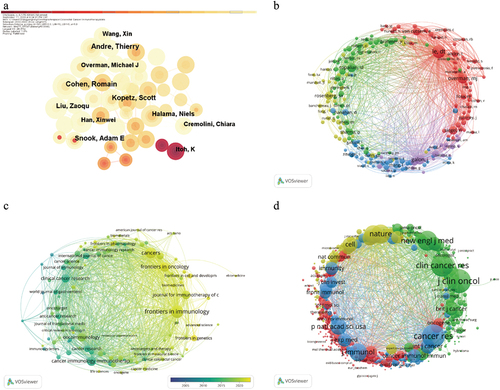
Table 3. Top 10 authors in terms of the number of publications and top 10 authors in terms of total citations.
Table 4. Top 10 journals in terms of the number of published papers.
Figure 5. The co-citation network of literature (a) and labels clustering of co-cited literature based on LLR algorithm (b) generated by CiteSpace.
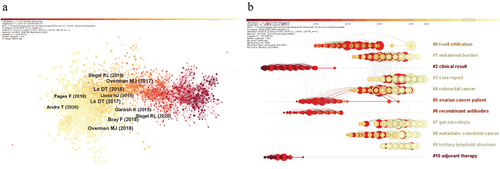
Table 5. Top 10 cited publications.
Table 6. Top 25 references with the strongest citation bursts.
Figure 6. Co-occurrence network graph (a) and clustering timeline graph (b) of keyword generated by CiteSpace. (c) Top 25 most cited keywords.
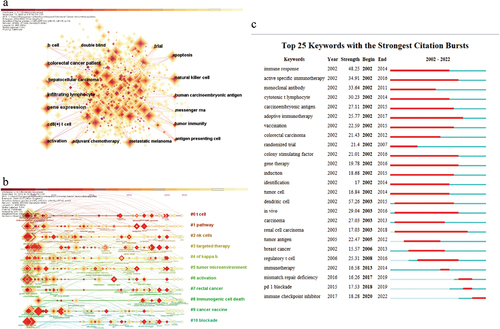
Table 7. Top 20 most frequent keywords analyzed using CiteSpace.
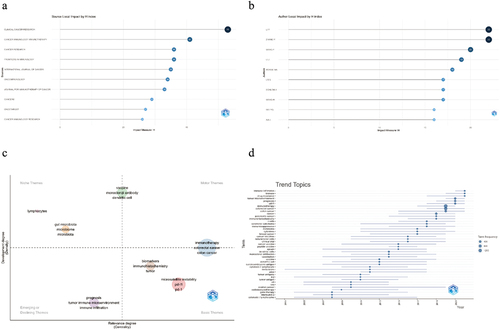
Figure 7. (a) Top 10 published journals ranked by H-index. (b) Top 10 authors ranked by H-index. The research trend quadrant chart (c) and research theme trend map (d) based on keyword.
Data availability statement
The data that support the findings of this study are available from the corresponding author, upon reasonable request.