
Figures & data
Figure 1. PRISMA flow diagram of screened and the selection process of studies on pooled prevalence of HPV vaccine uptake and determinant factors among adolescent school girls in sub-Saharan Africa, 2023.
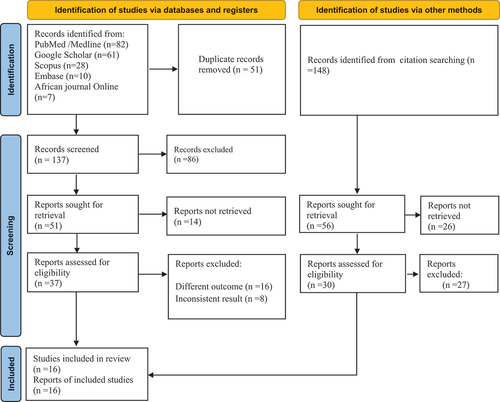
Table 1. Included study characteristics to estimate the pooled prevalence of HPV vaccine uptake and determinant factors in sub-Saharan Africa, 2023.
Figure 2. Forest plot depicting the pooled prevalence of HPV vaccine uptake among adolescent school girls in sub-Saharan Africa, 2023.
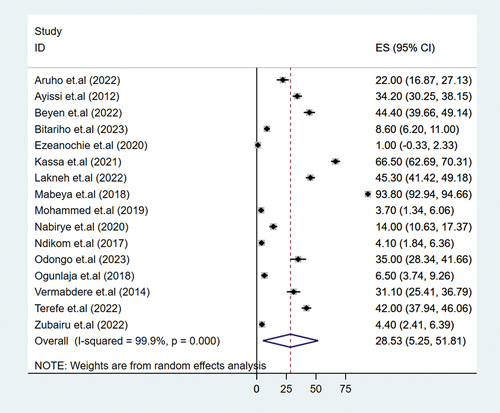
Figure 3. The pooled odd ratio of the association between good knowledge about HPV vaccine and HPV vaccine uptake among adolescent school girls in sub-Saharan Africa, 2023.
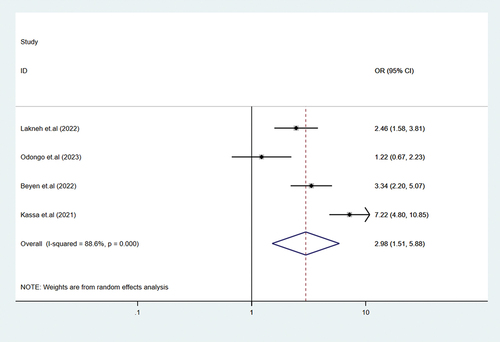
Figure 4. The pooled odd ratio of the association between positive attitude about HPV vaccine and HPV vaccine uptake among adolescent school girls in sub-Saharan Africa, 2023.
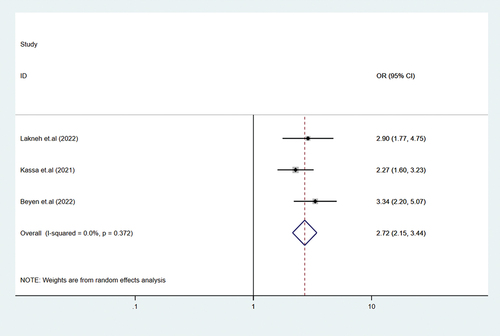
Figure 5. Forest plot depicting sub-group analysis by country for the pooled prevalence of HPV vaccine uptake among adolescent school girls in sub-Saharan Africa, 2023.
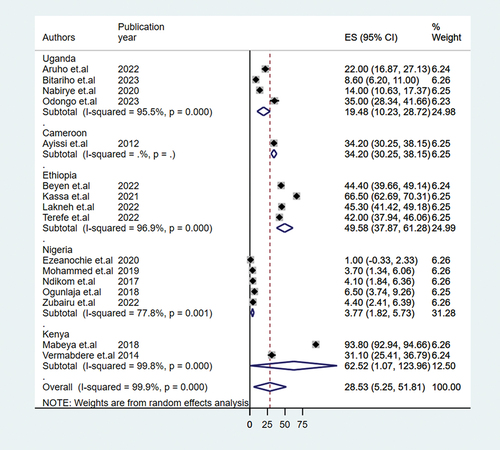
Table 2. Meta-regression to identify the source of heterogeneity for the estimated pooled prevalence of human papilloma vaccine uptake and determinant factors among adolescent school girls in sub-Saharan Africa, 2023.
Figure 6. Funnel plot depicting publication bias of studies reporting on the pooled prevalence of HPV vaccine uptake among adolescent school girls in sub-Saharan Africa, 2023.
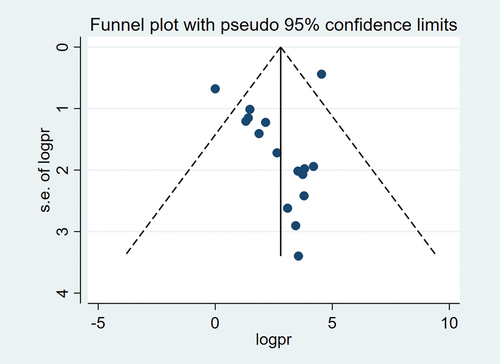
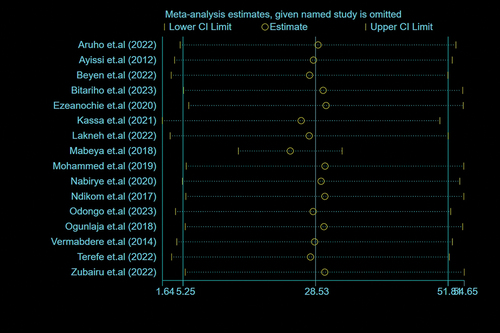
Figure 7. Sensitivity analysis on the studies included in the pooled prevalence of HPV vaccine uptake among adolescent school girls in sub-Saharan Africa, 2023.
Supplementary Material1 PRISMA 2020 Checklist.doc
Download MS Word (258.6 KB)Supplementary Material 2 Search strategy.docx
Download MS Word (16.5 KB)Supplementary Material 3 Newcastle Ottowa Scale.docx
Download MS Word (20.9 KB)Data availability statement
All associated data and supporting information are included in this systematic review and meta-analysis.