
Figures & data
Figure 1. PRISMA flowchart of included and excluded studies.
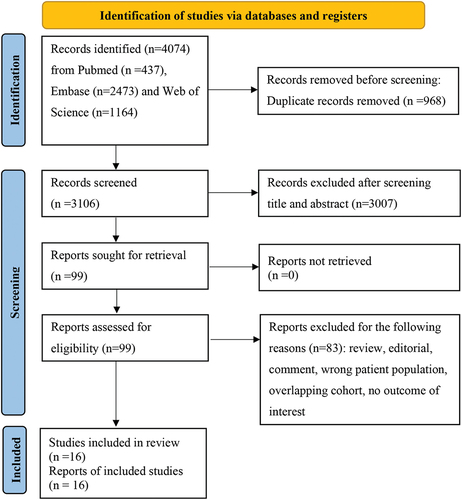
Table 1. Characteristics of the included studies.
Table 2. Quality assessment of the included studies by Newcastle-Ottawa scale (NOS).
Figure 2. Forest plot of the seroconversion rate following complete COVID-19 vaccination in patients of cirrhosis. CI, confidence interval.
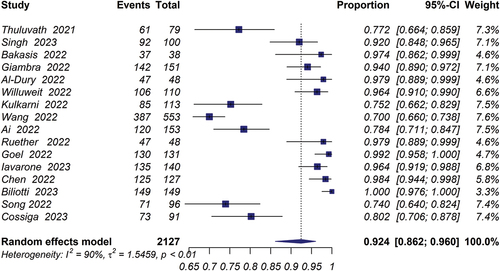
Figure 3. Forest plot of the comparison of seroconversion rate between compensated cirrhosis and decompensated cirrhosis.
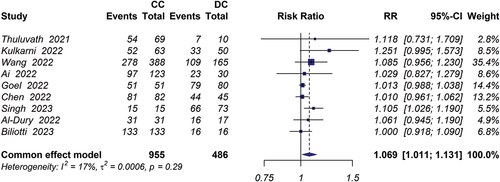
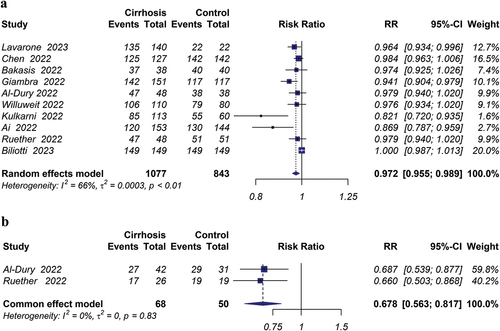
Figure 4. (a) Forest plot of the comparison of humoral immune response between cirrhosis patients and healthy controls; (b) Forest plot of the comparison of cellular immune response between cirrhosis patients and healthy controls.
Supplemental material