
Figures & data
Figure 1. Participant flow.
D, day; LTFU, long term follow-up; N, number of subjects; PPS, per protocol set.
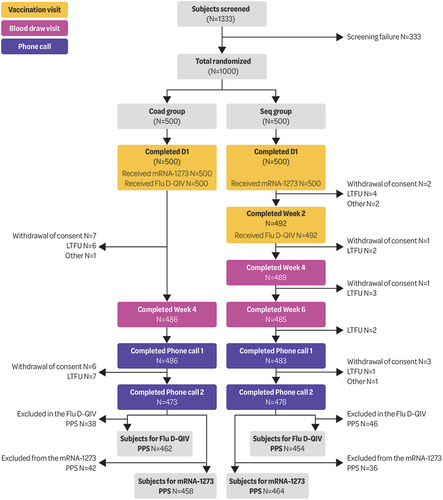
Table 1. Demographic characteristics of study participants (exposed set).
Figure 2. Adjusted geometric mean ratios (95% confidence intervals) of anti-spike antibodies and hemagglutinin inhibition 1 month post-vaccination (seq divided by Coad group) (per protocol set).
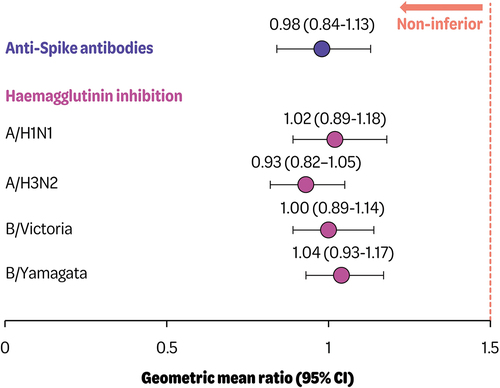
Figure 3. Percentage of solicited local and systemic adverse events reported per participant after the mRNA-1273 and QIV vaccinations (exposed set).
AE, adverse event; GI, gastrointestinal; mRNA-1273, Moderna’s mRNA COVID-19 vaccine; QIV, quadrivalent influenza vaccine.
Seq group received the mRNA-1273 booster dose followed 2 weeks later by QIV. Coad group received co-administration of the mRNA-1273 booster and QIV.
Grade 3 pain: Significant pain at rest. Prevents normal everyday activities; Grade 3 redness or swelling: >100 mm diameter; Grade 3 fever > 39.0°C (102.2°F); for other symptoms Grade 3 defined as prevented normal everyday activities.
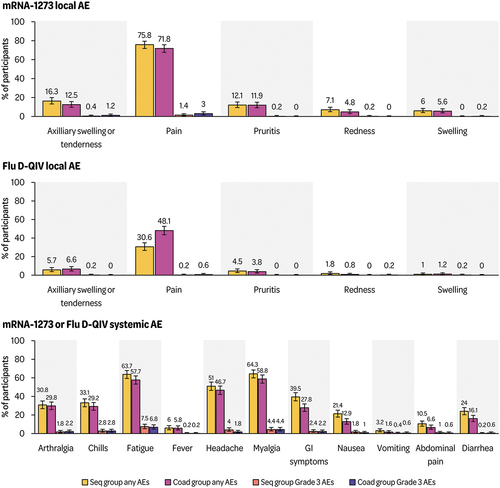
Table 2. Summary of published studies of mRNA COVID-19 booster doses co-administered with influenza vaccines.
Supplemental material
Supplemental online material_revised_clean.docx
Download MS Word (49.6 KB)Data availability statement
Please refer to GSK weblink to access GSK’s data sharing policies and as applicable seek anonymized subject level data via the link https://www.gsk-studyregister.com/en/.