Figures & data
Figure 1. Production of OMV-based C. trachomatis vaccines. (a-b) Schematic representation of the strategy for vaccine production. Soluble CTH522-SpT2 (A) or SpT2-HtrA (B) are conjugated to Salmonella OMVs displaying HbpD-SpC to yield the OMV-CTH522 and OMV-HtrA vaccine formulations. (c-d) Protein profiles of OMV-CTH522 (C) and OMV-HtrA (D) compared to non-conjugated control OMVs (OMV-Ctrl) as analyzed by SDS-PAGE and Coomassie staining. Adducts (HbpD-SpC-SpT2-CTH522, HbpD-SpC-SpT2-HtrA), non-conjugated HbpD-SpC, non-conjugated antigens (CTH522-SpT2, SpT2-HtrA) and the major outer membrane proteins (OMPs) as present in the OMV membrane are indicated. Molecular weight markers (kDa) are indicated at the left side of the panels.
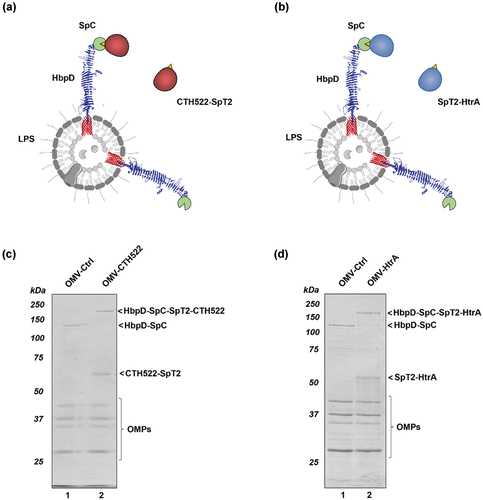
Figure 2. Intranasal immunization strategy and mouse tissue collection. B6C3F1 female mice were primed on day 0 and received two subsequent boosters on days 14 and 28, with each administration comprising 12 µg of either OMV-CTH522, OMV-HtrA, or OMV-Ctrl. Serum, vaginal fluid, draining cervical lymph nodes (cLns), and spleens of the vaccinated mice were collected 10 d after the third immunization.
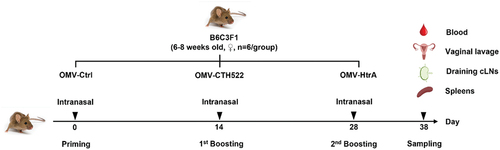
Figure 3. Humoral immune responses to C. trachomatis antigens. ELISA was used to assess antibody responses. (a-b) Post-vaccination kinetics of total serum and vaginal IgG against CTH522. (c-d) Post-vaccination total serum and vaginal IgG against HtrA. (e-f) pattern of IgG1 and IgG2a antibody responses specific to CTH522 in serum post-vaccination. (g-h) Post-vaccination IgG1 and IgG2a antibody responses specific to HtrA in serum. The error bars represent the standard error of mean (SEM). GraphPad Prism version 8.0 was used to analyze the statistically significant difference between the OMV-CTH522/OMV-HtrA and OMV-Ctrl vaccinated groups using ANOVA and Sidak’s multiple comparisons test. *p < .05, **p < .01, ***p < .001, ****p < .0001 and ns (not significant).
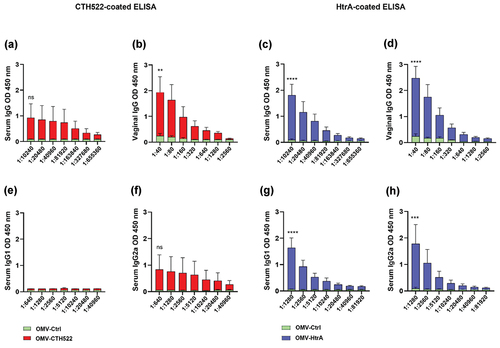
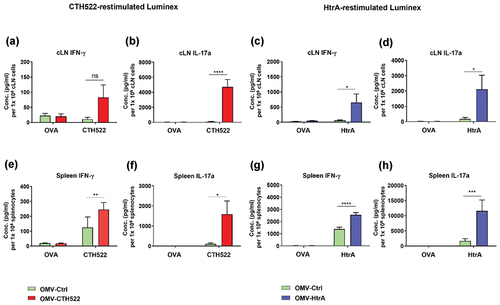
Figure 4. Antigen-specific cytokine released in the culture supernatants of cLN and splenic cells. Splenic and cLN cell suspensions (1 × 10⁶) were restimulated in vitro for 72 h with purified CTH522, HtrA, or OVA and released cytokines in cell culture supernatants were measured using Luminex assay. Levels of IFN-γ and IL-17a cytokines secreting from cLN cells (a-b) and splenocytes (e-f) after CTH522 and OVA stimulation. Levels of IFN-γ and IL-17a cytokines secreting from cLN cells (e-f) and splenocytes (g-h) after restimulation with HtrA and OVA. The standard error of mean (SEM) was used to express the results. ANOVA and Sidak’s multiple comparisons tests were used in GraphPad prism version 8.0 to determine statistically significant differences between the OMV-CTH522/OMV-HtrA and OMV-Ctrl vaccinated groups. *p < .05, **p < .01, ***p < .001, ****p < .0001 and ns (not significant).