
Figures & data
Figure 1. Seroprevalence at JUH with respect to the cumulative confirmed COVID-19 cases in the Tokyo metropolitan area.
Dots in the figure indicate seroprevalences at JUH, calculated by the number of N-specific positive HCWs divided by the number of HCWs who participated at annual health examinations with serological analysis.
A total of five mass vaccination campaigns were organized for HCWs at JUH, from March 2020 to November 2022, all using mRNA COVID-19 vaccines (BNT162b2 and mRNA-1273).
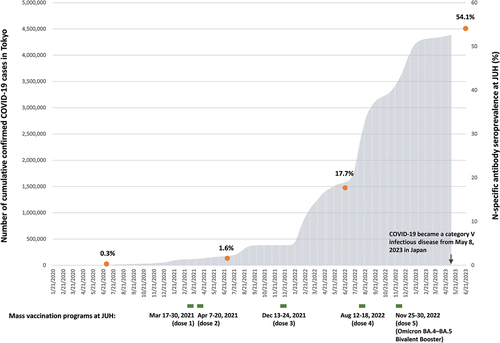
Table 1. N-specific antibody results among participants by characteristic categories (n = 3,594).
Table 2. Univariate and multivariate regression analyzes for seropositivity among participants (n = 3,594).
Supplemental material
R1_Supplementary Tables_clean.docx
Download MS Word (68.3 KB)Data availability statement
All data used in the study are shown in the figures and tables. There are no more data to disclose.