
Figures & data
Figure 1. Characterization of membrane vesicles of different clb mutant strains.
(a) Gene cluster of colibactin. Shown are the pks gene island that encodes proteins responsible for colibactin production. A series of clb genes that encode non-ribosomal peptide synthetase (NRPS), polyketide synthase (PKS), and hybrid NRPS-PKS are shown as light green arrows. Several clb genes encoding accessory proteins are shown as pink arrows. The three clb genes targeted in the present study are indicated by red circles. (b–d) Characteristics of MVs. Two biological replicates of MV preparations from ΔflhD, ΔflhDΔclbA, ΔflhDΔclbP, and ΔflhDΔclbS strains were tested. Shown are representative data from two independent experiments. Similar results were obtained in these experiments. (b) Morphology. MVs of ΔflhD, ΔflhDΔclbA, ΔflhDΔclbP, and ΔflhDΔclbS strains were observed using FE-SEM. (c) Protein profiles. MVs of ΔflhD, ΔflhDΔclbA, ΔflhDΔclbP, and ΔflhDΔclbS strains, and standardized at 4 μg/mL. Twenty microliters of each sample was applied to 12.5% polyacrylamide SDS-PAGE, followed by CBB staining. MW: molecular weight marker. (d) Particle distribution (DLS). Diameter histograms of the MVs of ΔflhD (parental, black), ΔflhDΔclbA (blue),ΔflhDΔclbP (red), andΔflhDΔclbS strains are shown. (e) Colibactin quantification. Colibactin amounts were estimated using the amount of N-myr-Asn (m/z+ = 346) calculated from the results of LC-MS analysis, with the authentic reference of N-myr-Asn as the standard. The Y-axis shows the amount of colibactin (ng) per 1 mg of whole cell (red) or MV (blue) samples.
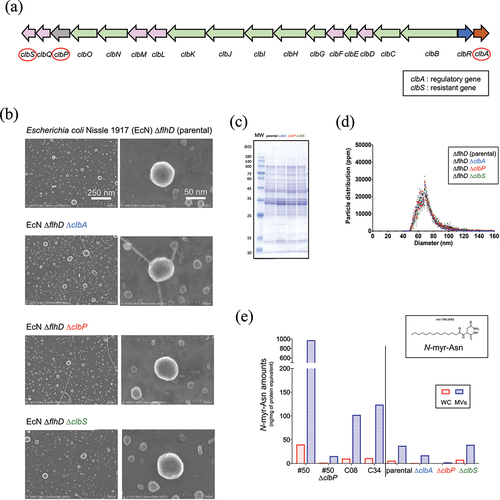
Figure 2. Mucosal adjuvanticity of MVs of different clb mutant strains.
(a) Timeline of immunization. The mucosal adjuvanticity of four different MVs (ΔflhD, ΔflhDΔclbA, ΔflhDΔclbP, and ΔflhDΔclbS) was examined using an intranasal immunization mouse model. Female BALB/c mice aged at six weeks were intranasally immunized twice with a two-week interval using four different arms: (i) OVA (5 µg)+ΔflhD-MVs (1 µg), (ii) OVA (5 µg)+ΔflhDΔclbA-MVs (1 µg), (iii) OVA (5 µg)+ΔflhDΔclbP-MVs (1 µg), and (iv) OVA (5 µg)+ΔflhDΔclbA-MVs (1 µg). At two weeks after the second vaccination, serum, saliva, nasal wash, and BALF samples were collected from the mice. Two independent animal experiments were conducted, and in each independent experiment four mice per arm were used. Therefore, shown are results of in total eight mice per arm. (b) OVA ELISA. ELISA was performed to examine OVA-specific serum IgM, IgG, IgA and IgE, salivary and nasal wash SIgA, and BALF IgG. Values are shown as OD405 (mean ± SD). Samples of serum, saliva, and nasal wash were diluted to 1:100, then used as primary antibodies for ELISA. All the values except for serum IgG were obtained after a 120-minute incubation with an alkaline phosphatase (AP) substrate. The value for serum IgG was obtained after 60 minutes of incubation with an AP substrate. Statistical analysis was performed using ANOVA and Tukey’s multiple comparison test. *p < .05. **p< .01.
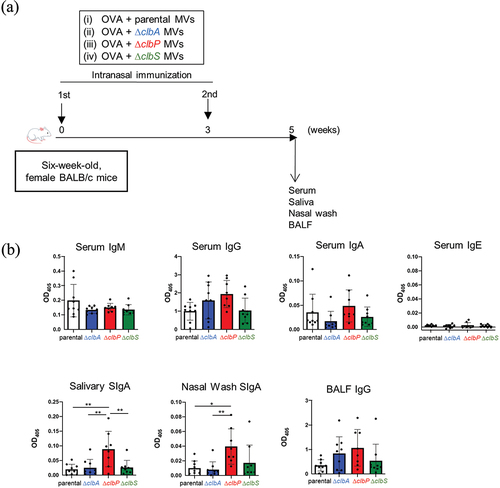
Figure 3. Characterization of MVs of parental and clbP mutant strains expressing pneumococcal serotype 14 capsular polysaccharide.
Protein profiles of whole cells (WCs) and MVs (a) and MV morphology (b) from parental (ΔflhD) and clbP mutant (ΔflhD ΔclbP) strains harboring an empty vector (CPS14: −) and CPS14 expression vector (CPS14: +). Three biological replicates of each WC and MV preparation were tested. Shown are representative data from three independent experiments. Similar results were obtained in three independent experiments. (a) Protein profiles of WCs (left panels) and MVs (right panels) of ΔflhD and ΔflhDΔΔclbP strains with or without CPS14 expression vector. Left panel: CBB stain. Middle panel: Western blot probed with anti-CPS14 antibody. Right panel: Fluorescent Western blot probed with anti-OmpA and anti-MBP antibodies. Asterisks (*) denote MBP signals. Daggers (†) denote OmpA signals. (b) Morphological analysis of MVs. Shown are representative FE-SEM images with low and high magnification of MVs (vector control) and CPS14+MVs.
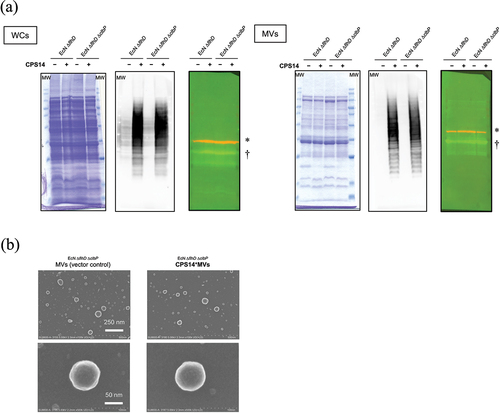
Figure 4. Humoral immune responses with two-dose vaccination regimen (Prime-Boost).
(a) Timeline of immunization and sample collection. Seven-week-old female BALB/c mice were immunized twice, at weeks 0 and 3, with CPS14+MVs (n = 32) or PBS (n = 8). The prime (1st) immunization was conducted via the SC route (n = 32), then the booster (2nd) immunization at week 3 was given to 32 SC-primed mice via the IN (n = 16) or SC (n = 16) route. At week 5, serum and salivary samples were obtained from all mice (shown by red square). (b) Humoral immune responses to CPS14. Serum and salivary sample obtained at week 5 were analyzed. Serum IgM, IgG, IgA, and IgE (top panels), serum IgG subclasses (IgG1, IgG2a, IgG2b, and IgG3) (middle panels), and salivary SIgA (upper right panel) were examined. For all ELISAs except for serum IgG, samples were used at 1:100 dilution, while those for IgG detection were used at 1:1,000 dilution. CPS14-specific antibody responses were analyzed by ELISA, for which the wells were coated with purified CPS14. The results are expressed as OD405 peak values (mean ± SD) after incubation with an AP substrate. Statistically significant differences are indicated by asterisks (*p ≤ .05, **p ≤ .01, ***p ≤ .001, ****p ≤ .0001). ND: no significant difference. One-way ANOVA followed by Tukey’s multiple comparison test was used for the statistical analysis.
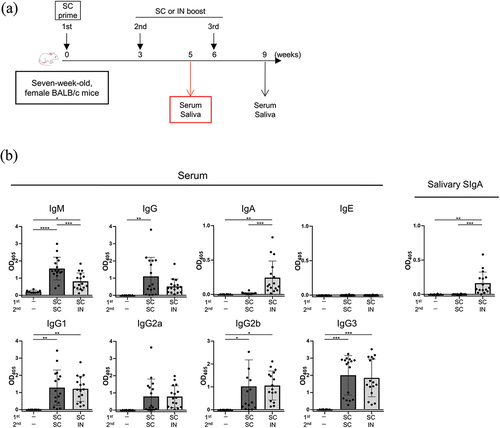
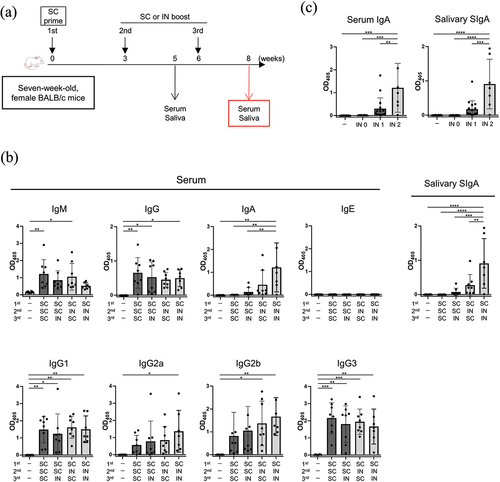
Figure 5. Humoral immune responses with three-dose vaccination regimen (prime-boost-additional boost).
(a) Timeline of immunization and sample collection. Seven-week-old female BALB/c mice were immunized twice at weeks 0, 3, and 6 with CPS14+MVs (n = 32) or PBS (n = 8). The prime (1st) immunization was conducted via the SC route (n = 32), then the booster (2nd) immunization at week 3 was conducted with 32 SC-primed mice, via the SC (n = 16) or IN (n = 16) route. Next, the homologous SC prime-SC boost and heterologous SC prime-IN boost groups were further divided into two subgroups. An additional booster (3rd) immunization was given to via the SC (n = 8) or IN (n = 8) route to mice in the SC-SC (n = 16) and SC-IN (n = 16) subgroups. At week 8, serum and salivary samples were obtained from all mice (shown by red square). Note that the number of mice in the SC-IN-IN subgroup analyzed by ELISA was 7, as one mouse in the subgroup died accidentally after the sample collection at week 5. (b) Humoral immune responses to CPS14. Serum and salivary sample obtained at week 8 were analyzed. Serum IgM, IgG, IgA, IgE and salivary SIgA (top panels), and serum IgG subclasses (IgG1, IgG2a, IgG2b, and IgG3) (bottom panels) were examined. For all ELISAs except for serum IgG, samples were used at 1:100 dilution, while those for IgG detection were used at 1:1,000 dilution. CPS14-specific antibody responses were analyzed by ELISA, for which the wells were coated with purified CPS14. The results are expressed as OD405 peak values (mean ± SD), after incubation with an AP substrate. Statistically significant differences are indicated by asterisks (*p ≤ .05, **p ≤ .01, ***p ≤ .001, ****p ≤ .0001). ND: no significant difference. One-way ANOVA followed by Tukey’s multiple comparison test was used for the statistical analysis. (c) Relationship between number of IN administration doses and the serum IgA or salivary SIgA immune response.
Supplemental material