
Figures & data
Figure 1. Study search and inclusion. The process of literature screening, inclusion, and exclusion followed the PRISMA guidelines.
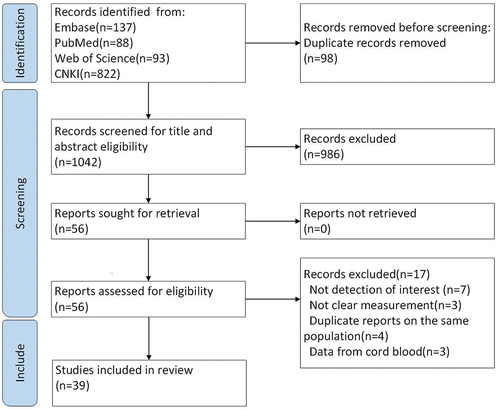
Table 1. Characteristics of included studies.
Figure 2. Forest plot of overall estimates of seropositivity rate of anti-PT IgG.
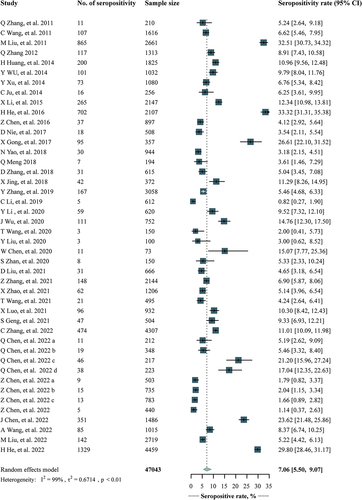
Table 2. Subgroup analysis for seropositivity rate of anti-PT IgG.
Table 3. The estimated age-specific seropositivity rate of anti-PT IgG in 2012, 2016, and 2020.
Supplemental material
supplementary materials_clean.docx
Download MS Word (530.1 KB)Data availability statement
All data required to evaluate the conclusions of this study are presented in the paper, Supplementary Materials, or both.