Figures & data
Figure 1. (a) The Cryo-TEM images and DLS particle size distribution of 60-80 nm (LNPs without encapsulated mRNA) (b–d) Cryo-TEM images and DLS particle size distribution of 80–100 nm,100–120 nm,120–150 nm mRNA-LNPs. Histogram of the mean particle size of the four groups of samples. Frequency count analysis of particle size data using the Origin 2019 software, each sample is an average of at least 30 readings. Scale = 100 nm.
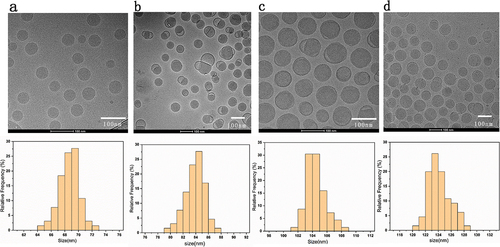
Figure 2. Analytical testing of the physicochemical properties of mRNA-lipid nanoparticles (LNPs) stored at 4°C for 6 months. (a) Particle size, (b) Zeta potential using electrophoretic light scattering, and (c) polydispersity were measured by dynamic light scattering, (d) determination of pH, (e) mRNA encapsulation determined by RiboGreen assay, while (f) mRNA purity was assessed by capillary electrophores. For (a) (b) (c) and (d), each data point is an average of at least 10 readings, resulting in the mean z-average, polydispersity, zeta potential, and pH values, which are displayed on the graphs. Analyses in (e)–(f) were done in triplicate. Error bars represent the standard deviation.
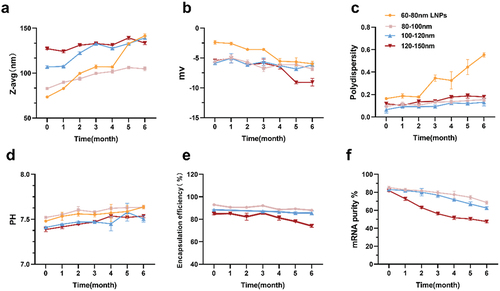
Figure 3. Ultra-high performance liquid chromatography (UHPLC) analysis of four lipid components of mRNA-LNPs. (a) Differences in changes of mPEG-DMG-2K in formulation stored at 4°C for 0, 3, and 6 months. (b) Differences in changes in cholesterol of the fractions after 0, 3 and 6 months of storage at 4°C. (c) Analysis of lipid content of the ionizable lipid (SM-102) in formulation fractions of different particle sizes. (d) Analyze differences in changes in DSPC after 0, 3 and 6 months of storage at 4°C.Calculations are described in the ‘Lipid Content Determination’ section of materials and methods. MOI%: the percentage of lipid content detected in the sample as a percentage of the labeled amount. Data were analyzed by a two-tailed unpaired t-test. *P < .05, **P < .01, ***P < .001. All panels were analyzed in triplicate.
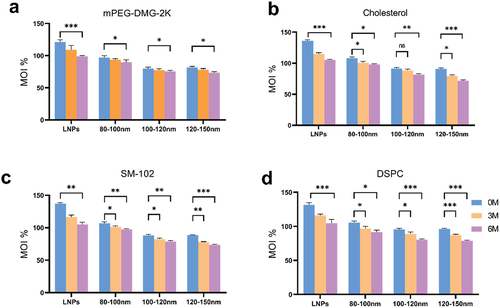
Figure 4. During the entire study, mRNA-LNPs were stored at 4°C, and the samples were stored after 3 and 6 months for evaluation of their biological activity. (a-b) Blood was collected from mice at 7 and 14 days after secondary immunization. (c–d) Blood was collected from mice on days 7 and 14 after secondary immunization when stored for up to 3 months. (e–f) Blood was collected from mice at 7 and 14 days after secondary immunization at 6 months of storage. (g-h) Comparison of serum antibody titers at different intervals for four groups of preparations. Data were analyzed through a two-way ANOVA, Data represent the mean ± SD (n = 6, ns p > .05, *p < .05, **p < .01, ***p < .001, ****p < .0001).
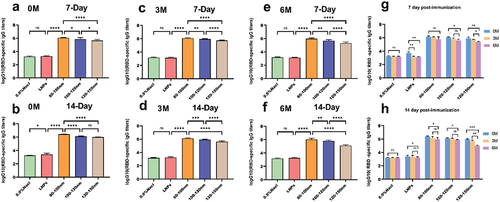
Figure 5. Analytical testing of the physical and chemical characteristics of mRNA-LNPs freeze at − 20°C for 0, 3, 6, 9, and 12 months. (a) Particle size, (b) Zeta potential was measured using electrophoretic light scattering, (c) polydispersity was measured by dynamic light scattering, (d) pH value of mRNA-LNPs, (e) mRNA encapsulation was determined by RiboGreen assay, and (f) mRNA purity was assessed by capillary electrophoresis. For (a) (b) (c), and (d), each data point was an aggregate of at least 10 measurements. Error bars are SD.
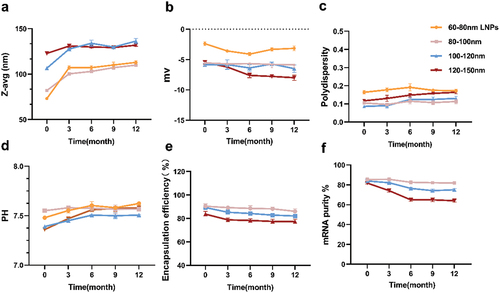
Figure 6. This figure is related to . Ultra-high performance liquid chromatography (UHPLC) analysis of individual lipid components of mRNA-LNPs. UHPLC analysis of freshly prepared mRNA-LNPs stored at − 20°C for 0, 3, 6,9, and 12 months. (a) Analysis of four components of 60–80 nm LNPs. (b)(c)(d) Analysis of four lipids from the vaccine set of mRNA-LNPs with different particle sizes(b)80-100 nm mRNA-LNPs; (c)100-120 nm mRNA-LNPs; and (d)120-150 nm mRNA-LNPs. For all panels, analyzes were done in triplicate, Error bars are SD.
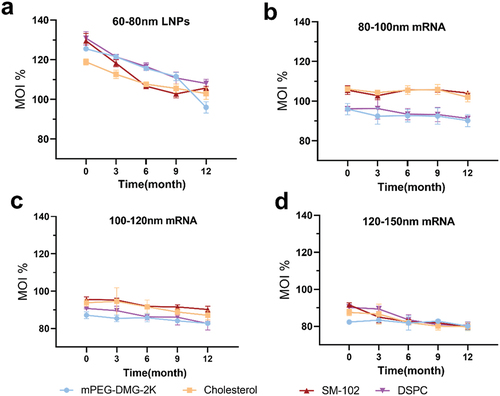
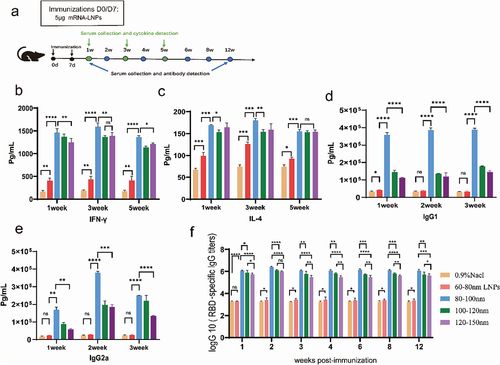
Figure 7. Humoral and cellular immune responses in mice immunized with the mRNA vaccine. Mice were immunized intramuscularly with 5 µg of mRNA vaccine, with a booster of the same dose 7 days after the first vaccination. (a) A schematic diagram of vaccination and sampling in mice. (b,c) Double antibody sandwich assay for determining the levels of IFN-γ and IL-4 in the serum of the mRNA-LNPs immunized mouse. (d,e) Serum levels of total IgG1/IgG2a were measured using ELISA kits. (f) ELISA for the determination of SARS-CoV-2 receptor binding domain-specific IgG antibody titers in immunized animals. Data are shown as mean ± SD, two-way analysis of variance (n ; ns p > .05, *p < .05, **p < .01, ***p < .001, ****p < .0001).