
Figures & data
Table 1. Patient characteristics.
Table 2. Respiratory function values.
Figure 1. IgG response pre-vaccination vs post-vaccination.
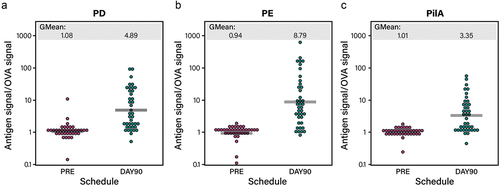
Figure 2. IgA response pre-vaccination vs post-vaccination.
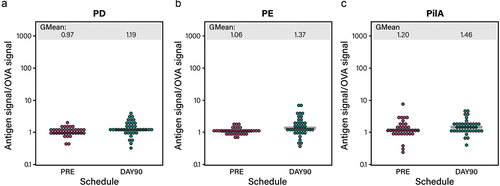
Figure 3. Correlation between IgG in serum and IgG in sputum.
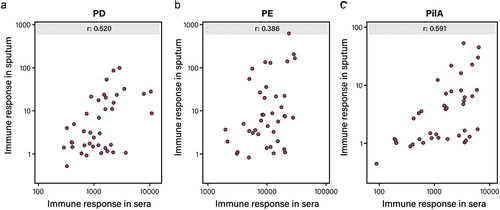
Figure 4. Correlation of disease severity with antigen-specific antibodies and sputum/serum ratio.
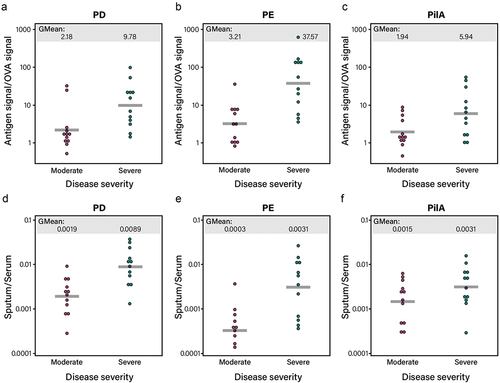
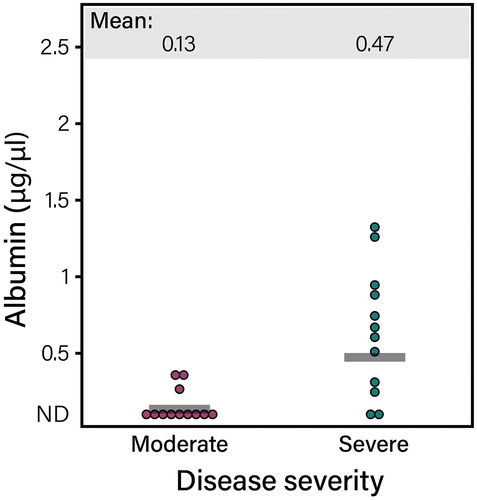
Figure 5. Transudation was detected in sputum from severe COPD patients.
NTHI004 lung mucosae R_HVI_supplemental material.docx
Download MS Word (662 KB)Data availability statement
GSK makes available anonymized individual participant data and associated documents from interventional clinical studies which evaluate medicines, upon approval of proposals submitted to www.clinicalstudydatarequest.com. To access data for other types of GSK sponsored research, for study documents without patient-level data and for clinical studies not listed, please submit an enquiry via the website. Clinical trial registration is NCT02075541.