
Figures & data
Figure 1. PRISMA flowchart detailing the number of records identified from searches and included in this manuscript. The number of records identified through database searches are combined for the systematic literature review and targeted literature review. HZ: herpes zoster; HCRU: healthcare resource utilization; PRISMA: preferred reporting items for systematic reviews and meta-Analyses; SLR: systematic literature review; TLR: targeted literature review.

Figure 2. Trends across age groups for (a) HZ incidence overall and (b) HZ incidence by sex across selected locales in Asia-Pacific. Open circles represent data for the specified age group and above (i.e., ≥70, ≥80 years). Only data points with values > 0.1 have been included. (a) For studies that reported HZ incidence for multiple periods, data for each period are represented by individual lines, with the period indicated after the study name. (b) Data are presented collectively for all locales included in the SLR and differentiated only by male and female to focus on overall potential sex-specific trends.aFirst data point was for age group 18–30 years; bFinal data point for 70–79 years was from year 2007. HZ: herpes zoster; PY: person-years. Articles included: Australia,Citation21–23 China,Citation24 Japan,Citation25–29 Korea,Citation30–32 and Taiwan.Citation33

Figure 3. Trends over time for (a) HZ incidence overall, (b) HZ incidence by sex, and (c) all HZ-related hospitalization rates across selected locales in Asia-Pacific. Only data for the overall population (all ages) have been included. Filled circles and solid lines represent data specific to the respective year and trend, respectively; open circles and dashed lines represent an average value over the period specified. (c) Hospitalization rates included all patients with HZ-related diagnosis (principal or non-principal), unless otherwise stated. aHospitalization for principal HZ diagnosis only; bStudy investigated HZ hospitalization rates in periods based on the availability and funding status of varicella vaccination in Australia; cStudy did not specify if hospitalization data included patients with principal and/or non-principal HZ diagnosis; dHospitalization for nonindigenous Australians up to age 70 years only. HZ: herpes zoster; PY: person-years. Articles included: Australia,Citation34–38 China,Citation24 Japan,Citation25,Citation28,Citation29,Citation39,Citation40 Korea,Citation30,Citation31,Citation41–44 New Zealand,Citation45 and Taiwan.Citation33,Citation46–48
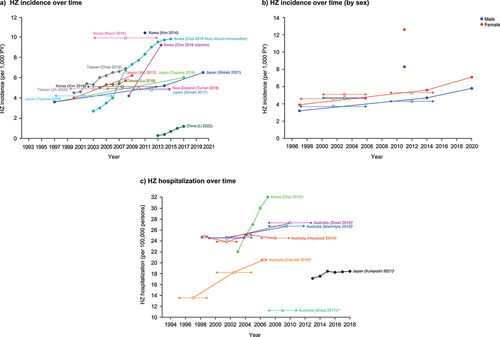
Table 1A. HZ incidence and recurrence rates across selected locales in Asia-Pacific (study-specific findings).
Table 1B. HZ-related hospitalization rates across selected locales in Asia-Pacific (study-specific findings).
Figure 4. Proportion of HZ cases with HZ-related complications across selected locales in Asia-Pacific. Black bars represent data of all HZ patients in the study population; blue bars represent data of a study population comprising hospitalized HZ patients only; orange bars represent data of a study population comprising HZO patients only. aPatients with pain persisting for at least 3 months from HZ onset; bStudy did not specify the duration of pain in patients diagnosed with PHN; cPHN was defined as pain persisting for at least 90 days after HZ rash healed; dPatients with persistent pain at 6 months from HZ onset; eData pooled from patients in Taiwan, Korea, and Thailand; fOther complications include motor dysfunction (Tang 2022) or were otherwise not defined. HZ: herpes zoster; HZO: herpes zoster ophthalmicus; PHN: postherpetic neuralgia. Articles included: dermatological/soft tissue infection,Citation26,Citation49,Citation69 disseminated HZ,Citation51,Citation54,Citation68,Citation70,Citation71 ear-related/Ramsay-hunt syndrome,Citation54,Citation68,Citation71 encephalitis,Citation51,Citation54,Citation68 lower respiratory tract infection,Citation49 meningitis,Citation51,Citation68,Citation72,Citation73 meningitis encephalitis,Citation71 neurological,Citation26, Citation51,Citation68–70,Citation72 ocular/ophthalmic,Citation26,Citation49,Citation51,Citation54,Citation55,Citation68–72 ,Citation74–76 PHN,Citation26,Citation27,Citation35,Citation46,Citation47,Citation52–54,Citation59,Citation68–71,Citation75,Citation77–89 vision loss,Citation90,Citation91 and other.Citation26,Citation51,Citation54,Citation70,Citation72,Citation92.
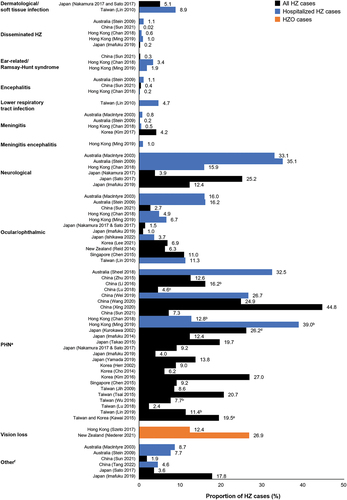
Table 2. HZ-related healthcare resource utilization in patients with HZ across selected locales in Asia-Pacific (mean per HZ case across period of available data, unless otherwise stated).
Table 3. HZ-related adjusted-direct and indirect costs, and cost components across selected locales in Asia-Pacific.
Table 4. HZ-related quality of life outcomes across selected locales in Asia-Pacific.
Data availability statement
This systematic literature review protocol was not registered. Data sharing of anonymized subject level data is not applicable to this article. All data supporting the findings of this study were obtained from the references cited.