Figures & data
Figure 1. Model diagram of the seasonal influenza transmission and vaccination.
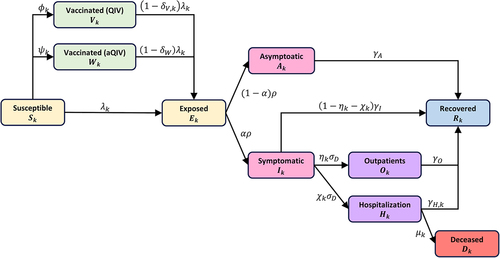
Table 1. Description of epidemiological parameters and baseline values.
Table 2. Input data for cost, utilities, and disutilities used in the cost-effectiveness analysis.
Table 3. Health outcomes and overall costs (USD, $) for each seasonal influenza vaccination strategy.
Table 4. Effects of vaccinating all individuals with QIV versus aQIV administration for adults ≥65 years on incremental costs (USD, $), incremental QALYs, and ICERs ($/QALY).
Figure 2. Cost-effectiveness acceptability curves depicting the cost-effective probability of aQIV versus QIV based on the efficacy of aQIV.
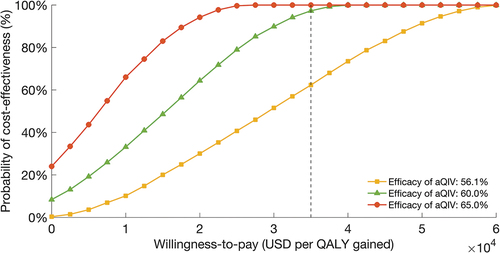
Figure 3. One-way deterministic sensitivity analysis.
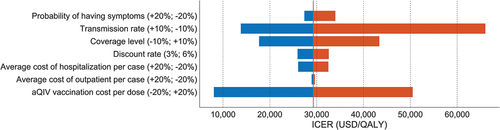
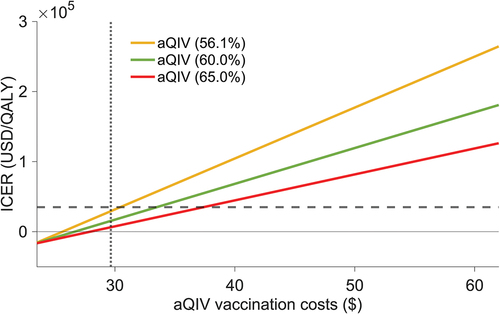
Figure 4. Incremental cost-effectiveness ratios based on the total vaccination costs.