Figures & data
Table 1. Model inputs for demographic, epidemiology, and vaccination parameters.
Table 2. Base case results in the mass vaccination setting (30% coverage).
Figure 1. Number of cases of (a) HZ, (b) PHN, (c) other complications avoided in the mass vaccination setting (30% coverage), by age cohort.
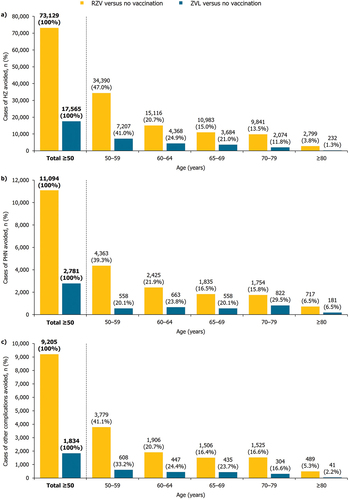
Figure 2. NNV to prevent one case of (a) HZ, (b) PHN, by age cohort.
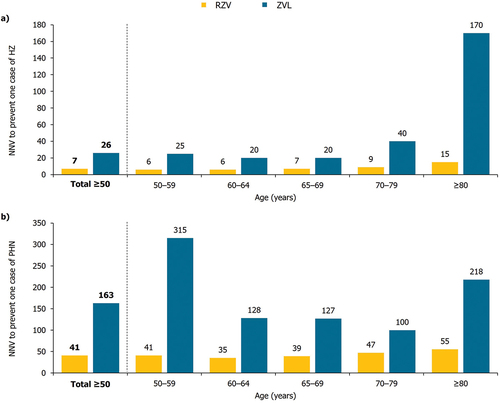
Table 3. Base case results for hospitalizations in the mass vaccination setting (30% coverage), by age cohort.
Table 4. Scenario analysis results in the aggregated cohort of adults ≥ 65 YOA, under the mass vaccination setting (30% coverage).
Table 5. Scenario analysis results for hospitalizations in the aggregated cohort of adults ≥ 65 YOA, under the mass vaccination setting (30% coverage), by age cohort.
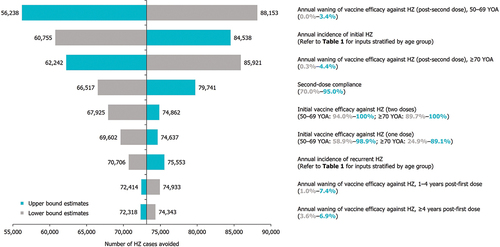
Figure 3. DSA on cases of HZ avoided with RZV vaccination versus no vaccination, in the mass vaccination setting (30% coverage).