
Figures & data
Figure 1. SPP1 expression associated with clinical benefits of IO-TKI therapy in RCC.
(a) Expression of SPP1 in responders and non-responders of IO-TKI therapy in RCC by transcriptome sequencing. p value, Wilcoxon signed-rank test. (b & c) The presentative chest computed tomography (b) and therapeutic response in the ZS-MRCC cohort under IO-TKI therapy (c), SPP1 expression of samples, analyzed through transcriptome sequencing, separating into high/low groups. (d) Heterogenous RECIST clinical response of IO-TKI therapy in the high/low SPP1 groups. p values, Kruskal-Wallis H test. *p < .05; **p < .01; ***p < .001; ns, not significant.
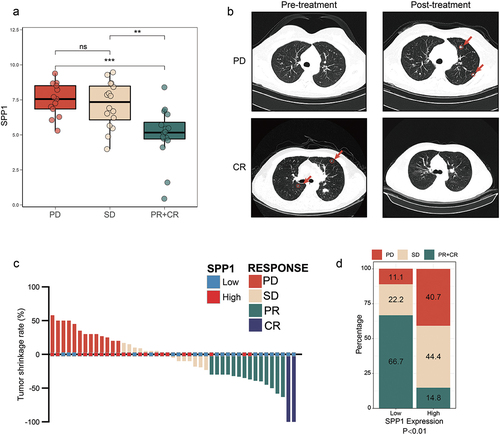
Figure 2. Prognostic value of SPP1 expression for IO-TKI therapy in metastatic RCC.
(a) PFS of the TxNxM1 cases from TCGA cohort in the high/low SPP1 groups classified by RNA sequencing. p value, log-rank test. (b & c) PFS after TKI-IO therapy according to SPP1 expression, evaluated by RNA sequencing, in both ZS-MRCC cohort (b) and IO-TKI subgroup of Javelin Renal 101 cohort (c). p value, Kaplan-Meier analysis, and log-rank test. (d) Univariate and multivariate survival analysis for metastatic RCC in the ZS-MRCC cohort. Hazard ratio and p values, Cox regression analysis.
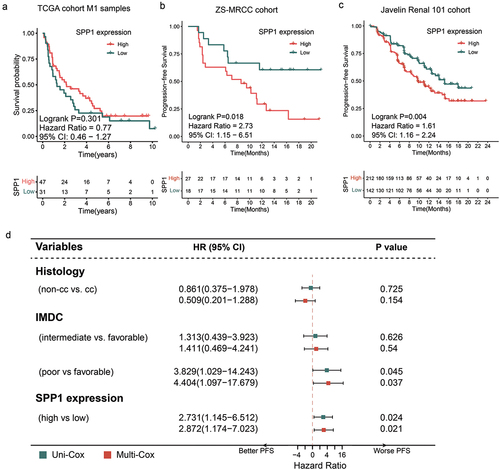
Figure 3. Association between SPP1 and T cell infiltration in RCC.
(a) Heatmap of IHC analysis revealed the expression levels of tumor microenvironment biomarkers in the high and low SPP1 of high-risk localized RCC samples. The categorization of samples into high and low SPP1 groups was determined using RNA sequencing analysis. (b–d) Representative images of IHC and the correlation between the quantification of TILs (b), CD8+ T cells (c), CD4+ T cells (d) and SPP1 expression of high-risk localized RCC samples (RNA sequencing). ρ and p values, Spearman’s rank-order correlation. (e) Representative images of flow cytometry and the association between CD8+ T cells (f) or CD4+ T cells (g), and SPP1 expression of high-risk localized RCC samples (RNA sequencing). ρ and p values, Spearman’s rank-order correlation.
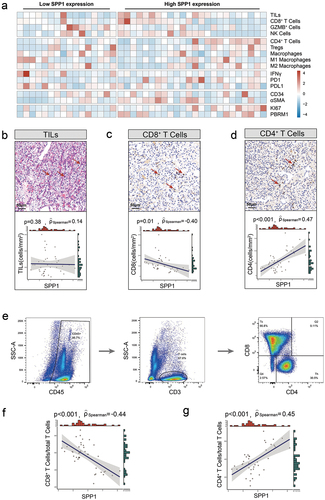
Figure 4. SPP1 is associated with T cell dysfunction and tregs infiltration in RCC.
(a–d) Gating strategy of PD1+CD8+ T cells (a), GZMB+CD8+ T cells (b), and Tregs (CD4(+), CD25(+), CD127(-/low)) (c), and their association with SPP1 expression (RNA sequencing) in high-risk localized RCC samples. (d) Representative images and quantification of Tregs by IHC and its correlation with SPP1 expression. ρ and p values, Spearman’s rank-order correlation. (e) Volcano plot of GSEA of Gene Ontology pathways between high and low SPP1 samples (RNA sequencing). (f & g) Association between CXCL1 (f) and CXCL8 (g) expression and SPP1 in the TCGA-KIRC cohort. ρ and p values, Spearman’s rank-order correlation in the Javelin Renal 101 cohort. (h) Somatic mutations sorted to the level of SPP1 expression. p values, Chi-square test. ***, p < .001.
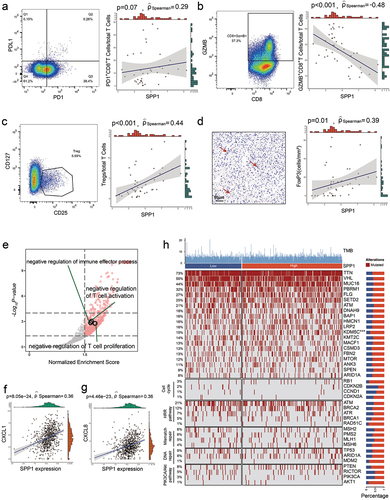
Figure 5. SPP1 is related with T cell exhaustion in RCC.
(a) Heatmap displaying of IHC checkpoints and key transcription factors of T cell exhaustion according to the expression level of SPP1 in high-risk localized RCC samples. (b–d) Representative images of IHC and quantification of EOMES+ (b), LAG3+ (c), and TIGIT+ (d), and their association with SPP1 in high-risk localized RCC samples by IHC. ρ and p values, Spearman’s rank-order correlation.
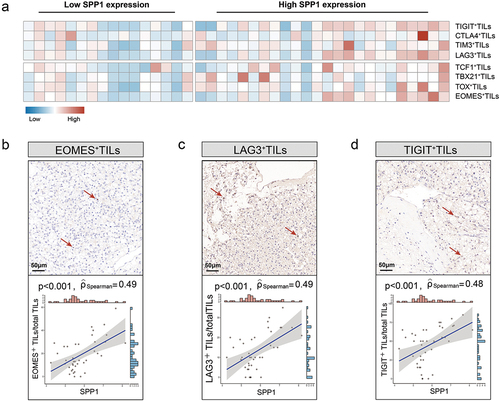
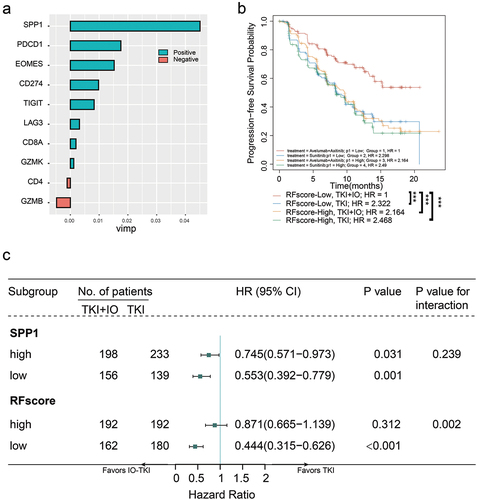
Figure 6. An integrated risk score model for IO-TKI benefit versus TKI monotherapy.
(a) Variable Importance of random forest model parameters, including SPP1, PD1, EOMES, PDL1, TIGIT, LAG3, GZMK, CD8A, CD4, and GZMB. (b) Kaplan-Meier analysis of advanced RCC with IO-TKI arm or TKI arm, in different risk score subgroups. p value, Kaplan-Meier analysis, and log-rank test. (c) The Cox regression model was performed to assess HR and 95% CI of SPP1 expression and random forest model parameters. HR < 1 indicates better survival with IO-TKI therapy. HR > 1 indicates better survival with the TKI monotherapy. Hazard ratio and p values, Cox regression analysis.
Supplemental material
Supplementary Table S1.doc
Download MS Word (53.5 KB)Data availability statement
Data from the study can be shared with other researchers upon reasonable request, according to the data-sharing policy.