
Figures & data
Figure 1. CE of QIVc vs QIVe, itemized by study perspective, time horizon, population and estimated local willingness-to-pay threshold.Citation25,Citation27,Citation29–35
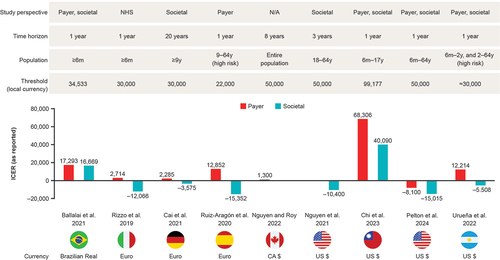
Table 1. CEA of QIVc versus QIVe.
Table 2. Variation in rVE estimates of QIVc versus QIVe as part of sensitivity/scenario analyses.Citation25,Citation27,Citation29–35