
Figures & data
Table 1. Comparison of antigen components in each vaccine.
Figure 1. The consort flow diagram of this study.
Figure 2. Geometric mean concentrations (GMCs) of anti-DT IgG (a), anti-TT IgG (b) from birth to 6 y, and anti-Hib IgG (c) from birth to 3 y among the aP (red), wP (blue), and EPI wP (green) cohort. Data from birth to month 19 were previously published.Citation16 Error bars denoted 95% confidence interval.
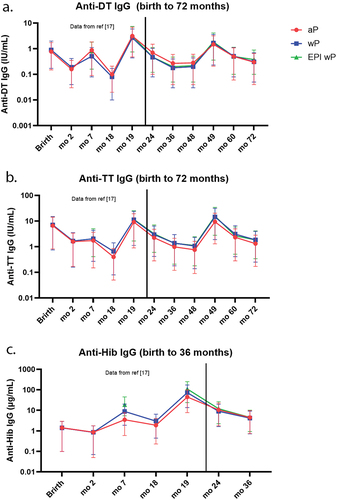
Table 2. Percentages of children achieving diphtheria, tetanus, and Haemophilus influenzae b seroprotection between 2 and 6 y of age.
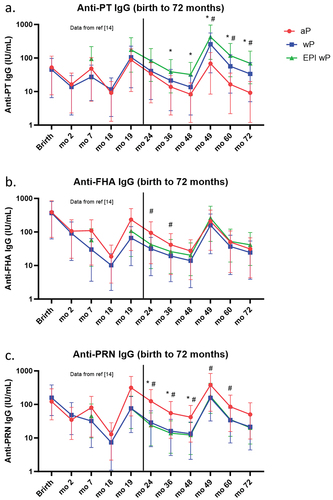
Figure 3. Geometric mean concentrations (GMCs) of anti-PT IgG (a), anti-FHA IgG (b), and anti-PRN IgG (c) from birth to 6 y among aP (red), wP (blue) and EPI wP (green) cohort. Data from birth to month 19 were previously published.Citation14 Error bars denoted 95% confidence interval. Statistical differences between the antibody levels among children from different groups were analyzed using Kruskal–Wallis test followed by Dunn’s test for multiple comparison adjustments. Statistical significance was indicated as follows: #adjusted p-value <.05 between aP and wP group, *adjusted p-value <.05 between aP and EPI wP group.
Supplement Material DTPHib 17042024.docx
Download MS Word (54.8 KB)Data availability statement
Data will be available upon request.