Figures & data
Table 1. Total number and average number of vaccinated children between 2019 and 2022.
Figure 1. Total annual vaccinations presented in number of children vaccinated A) in absolute number and B) per 1000 population.
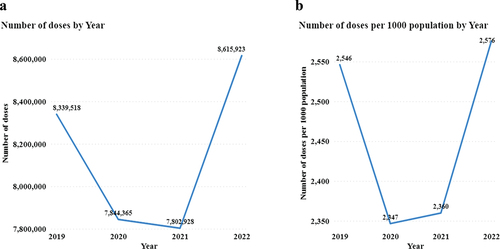
Figure 2. Number of vaccinations per month between Jan 2019 and Dec 2022.
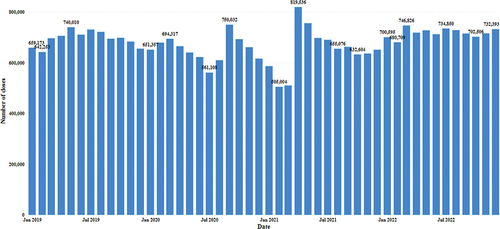
Figure 3. Number of vaccinations per month by type of vaccine between 2019 and 2022. Panel A: BCG and OPV; Panel B: PCV and Penta; and Panel C: MR and Rota.
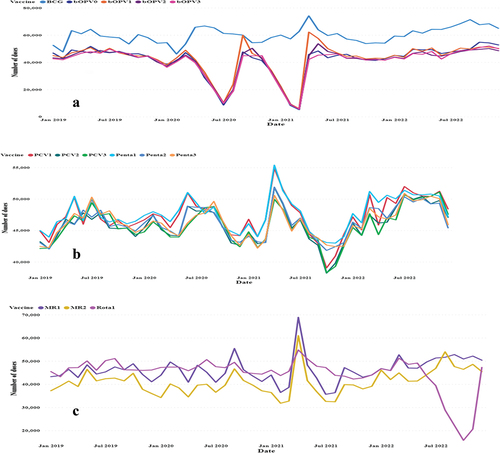
Figure 4. Number of vaccinations children per 1000 people by year and region between 2019 and 2022.
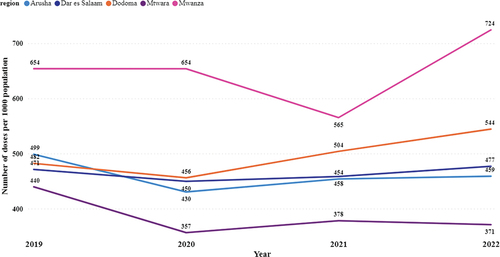
Figure 5. Cumulative vaccination in each district from 2019 to 2021 as the number of children vaccinated per 1000 people given to children.
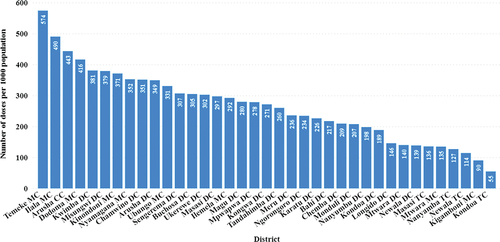
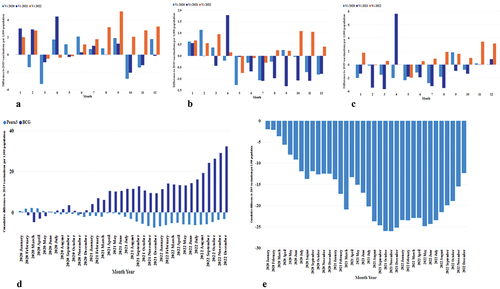
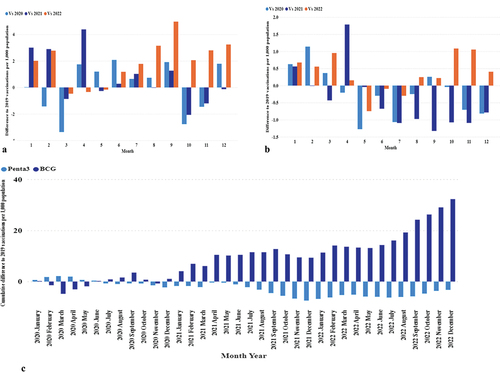
Figure 6. Monthly and cumulative differences in vaccination rates from 2019. Panels A-C: Monthly differences for BCG, Penta3, and MR2. Panels D-E: Cumulative differences for BCG (dark blue) and Penta3 (light blue) (D), and MR2 (E).