Figures & data
Table 1. Discrete choice experiment attributes and levels.
Table 2. Respondent characteristics by latent class.
Figure 1. Attribute-level preference weights by latent class.
Attributes are shown in the order in which they were presented in the DCE choice tasks. Larger vertical distance between the preference weights across attribute-levels reflect a greater strength of preference for the respective change. For example, increasing effectiveness from 50% to 63% yielded a change in utility of approximately 1.5 (i.e., −0.5−[−2.0]) for the Effectiveness Group and approximately 0.8 (i.e., −0.2−[−1.0]) for the No Preventive Group. Increasing duration of protection during RSV season from 4.5 months to 6 months yielded a change in utility of approximately 0.2 (i.e., 0.6−0.4) for the Effectiveness Group and approximately 0.1 (i.e., 0.3−0.2) for the No Preventive Group. Therefore, an incremental increase in effectiveness from 50% to 63% is 7.5 times as important to those in the Effectiveness Group (i.e., 1.5 ÷ 0.2) and 8.0 times as important to those in the No Preventive Group (i.e., 0.8 ÷ 0.1) as an increase in duration of protection from 4.5 months to 6 months. The large negative estimate of the no-preventive option (−4.7) among the Effectiveness Group indicates that they are more likely to choose an RSV preventive option than the opt-out option across choice tasks; in contrast, the positive estimate for the no-preventive option (2.2) among the No Preventive Group indicates that they are more likely to choose the opt-out option than an RSV preventive option across choice tasks. PP: pregnant people; RSV: respiratory syncytial virus.
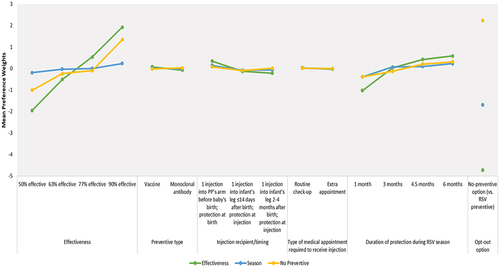
Figure 2. Attribute relative importance by latent class.
Relative importance is the importance of moving from the least preferred level of an attribute to the most preferred level of that attribute, relative to all the other attributes and conditional on the ranges of levels of all attributes. Relative importance estimates sum to 100% across attributes for each of the three latent classes. Attributes are presented in descending order of importance for the Effectiveness Group.
*Relative importance estimate is based on changing from ‘1 injection into infant’s leg ≤14 days after birth; protection at injection’ to ‘1 injection into pregnant person’s arm before baby’s birth; protection at birth’ for the Season Group and the No Preventive Group and changing from ‘1 injection into infant’s leg 2-4 months after birth; protection at injection’ to ‘1 injection into pregnant person’s arm before baby’s birth; protection at birth’ for the Effectiveness Group.
**Relative importance estimate is based on changing from ‘mAb’ to ‘vaccine’ for the Effectiveness Group and the Season Group and changing from ‘vaccine’ to ‘mAb’ for the No Preventive Group.
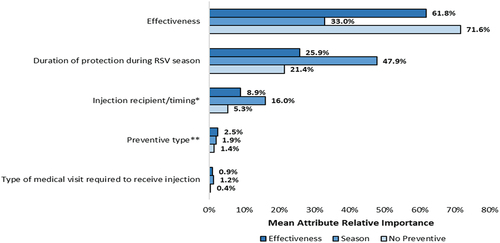
Figure 3. Association of respondent characteristics and latent class membership for (a) effectiveness group versus the season group and (b) no preventive group versus the season group.
Odds ratios, adjusted for all other variables in the model, with 95% confidence intervals are shown. Variables are listed in the order in which they are shown in the figures. The Season Group was used as the reference group for the outcome variable in the model. Seriousness of RSV for infants used responses to the following item: “How serious do you think RSV infection can be for babies (12 months of age or younger)?” Seriousness of RSV for pregnant people used responses to the following item: “How serious do you think RSV infection can be for pregnant women?” Health literacy used responses to the following item: “How confident are you filling out medical forms by yourself?” Social support used responses to the following item: “How easy is it for you to get help from family, friends, or neighbors if you need it?”
*p < .05, 2-tailed.
†Includes response options of ‘not at all serious,’ ‘slightly serious,’ and ‘don’t know.
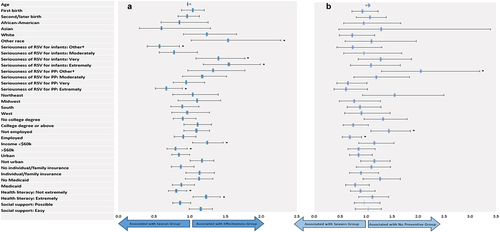
Figure A1. Example discrete choice experiment choice task.
Options for effectiveness: 50%, 63%, 77%, 90%; injection recipient/timing: pregnant person’s arm before their baby is born, injection into infant’s leg 14 days after birth, injection into infant’s leg 2-4 months after birth; duration of protection (months during the RSV season): 1, 3, 4.5, 6. Injection recipient and timing of protection were presented as separate attributes for ease of comprehension, but the attributes were linked in how they were presented to preclude illogical combinations (e.g., “Protection begins at birth” never appeared with “Single injection into a baby’s leg 2-4 months after birth”); they were treated as one attribute in analyses. FDA: Food and Drug Administration; RSV: respiratory syncytial virus.
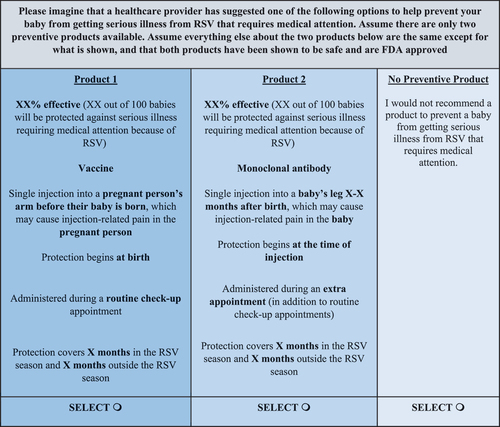
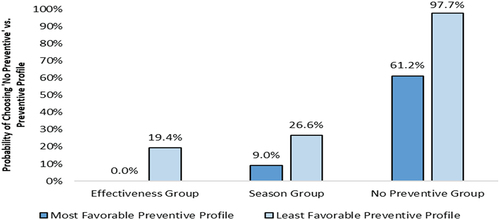
Figure A2. Most and least favorable RSV preventive profiles.
RSV: respiratory syncytial virus.
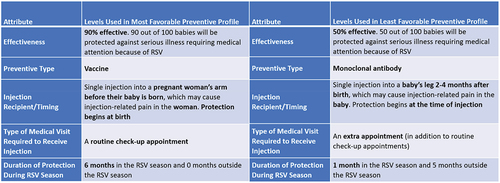
Figure A3. Probability of choosing the no-preventive option versus the most and least favorable RSV preventive profiles by latent class.