
Figures & data
Figure 1. Design and synthesis of mRNA encoding B9-hFc. (a) B9-hFc and mRNA sequence design. (b) Capillary electrophoresis of RNAs from RNA clean beads purified sample after in vitro preparation. Capillary electrophoresis results were plotted using OriginPro (version 8.5).
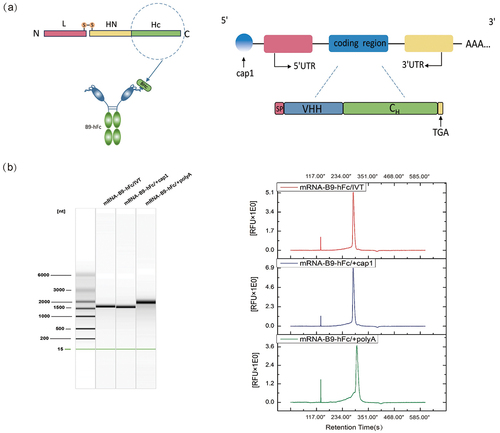
Figure 2. In vitro expression of mRNA-B9-hFc. (a) BHc binding activity of the antibodies by ELISA. The concentration of the antigen was 2 μg/mL, while the initial concentration of recombinant B9-hFc protein was set at 0.25 μg/mL. (b) B9-hFc concentrations in mRNA-transfected cell lines. Determine the antibody concentration in the cell supernatant by using the standard curve and the OD450nm/595 nm value of the sample well.
Figure 3. In vivo expression of mRNA-B9-hFc. (a) mRNA-B9-hFc-LNPs particle size analysis results. The schematic in the top left corner of the figure represents its complex structure. (b) Curve of time versus plasma concentrations of mRNA-encoded antibody. The blue line represents the expression level of the mRNA-encoded B9-hFc, while the beige line represents the level of the B9-hFc.
Figure 4. Prophylactic protection provided by the mRNA-encoded B9-hFc against toxin challenges. (a) Protective effects of 100 μg of mRNA-B9-hFc-LNPs against 100 LD50 of BoNT/B in mice (n = 4). The x-axis represents the observation time after exposure of mice to BoNT/B. Mice per group were monitored for survival over 7d. (b) Concentrations of B9-hFc at various timepoints after injection with a 100-μg dose of mRNA-B9-hFc-LNPs or 40-μg of B9-hFc in treated mouse serum. The left graph shows the concentration of mRNA-encoded B9-hFc. The right graph shows the concentration of the recombinant B9-hFc protein.
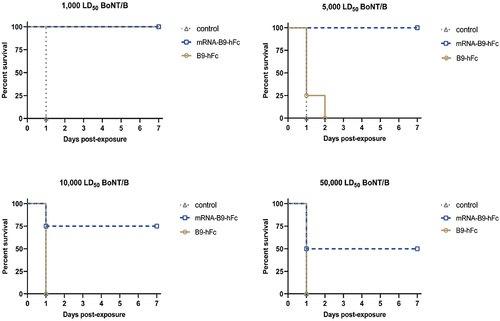
Figure 5. Protective effects of 100 μg of mRNA-B9-hFc-LNPs against higher doses of BoNT/B in mice (n = 4). The x-axis represents the observation time after exposure of mice to BoNT/B. Mice per group were monitored for survival over 7d.
Supplemental Material
Download PDF (151.9 KB)Supplemental Material
Download PDF (161.1 KB)Data availability statement
The datasets generated during and/or analyzed during the current study are available from the corresponding author on reasonable request.