
Figures & data
Figure 1. Hm0487 binds SEB with high affinity.
(a) The affinity between Hm0487 and SEB or mSEB is determined by ELISA, where the absorbance measured at 450 nm across a range concentration of Hm0487 (0.000488 μg/mL to 1 μg/mL) is shown. (b and c) Kinetic analysis of the interaction between Hm0487 and SEB or mSEB at various concentrations (12.5 nM-100 nM) assessed by BLI. (d) WB analysis demonstrates the specificity of Hm0487 in recognizing a linear epitope on both SEB and mSEB.
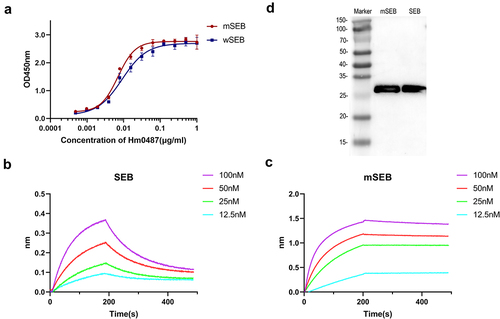
Figure 2. Hm0487 recognizes a novel liner epitope in SEB.
(a) The overall structure of the binary complex formed by mSEB and the Fab fragment of Hm0487 is depicted. (b) A ribbon drawing showing the domain organization of mSEB. (c) A ribbon drawing showing the interactions between mSEB and the Fab fragment of Hm0487. (d) Detailed interactions between mSEB and the Fab fragment of Hm0487 are illustrated. The SEB molecule is represented in green, while the heavy chain and light chain of the Fab fragment are colored magenta and cyan, respectively.
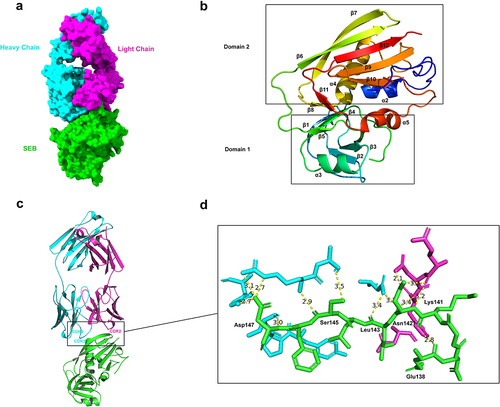
Table 1. Refinement statistics for mSEB-Hm0487Fab.
Table 2. The interactions between SEB and the Fab of Hm0487.
Figure 3. SEB interacts with TCR, MHC-II and Hm0487 through distinct domains.
(a) Structural model of the TCR-SEB-MHC-II complex (PDB: 4C56) along with the Fab fragment of Hm0487. (b) Surface representation of SEB (green) illustrates the areas where it interacts with TCR (orange), MHC-II (cyan), and Fab (red). (c) Ribbon representation of SEB (green) focusing on the interaction sites with the Fab (red) and the linear epitope SEB150-161 (olive). (d and e) BLI response showing the binding of SEB with immobilized TCR and MHC-II in the presence of 20 nM and 100 nM Hm0487. (f) The binding of SEB to immobilized receptors was calculated from the competitive binding assays. (g) Competitive ELISA is used to access the effect of Hm0487 on immobilized SEB binding CD28. Difference was compared by One-way ANOVA, Tukey’s multiple comparison test, **p < .01, ns, not significant. Data are presented as the mean ± SD.
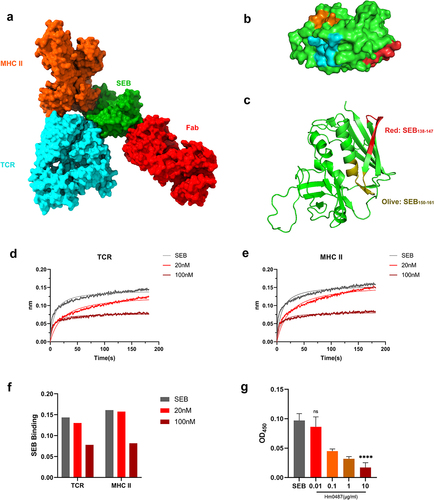
Figure 4. Hm0487 impact the binding of SEB with target cells.
Representative flow plots and mean fluorescence intensity of CD3+ cells (a and b) and CD3− cells (c and d) as measured by FACS in the presence of Hm0487 or Fab. Difference was compared by One-way ANOVA, Tukey’s multiple comparison test, and two-tailed Student’s t test, **p < .01, ns, not significant. Data are presented as the mean ± SD.
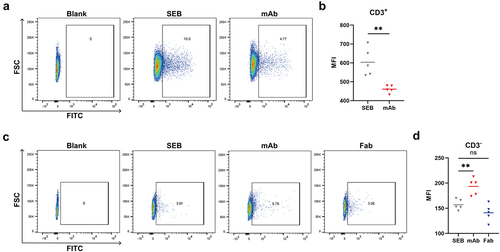
Figure 5. Hm0487 protect mice from lethal SEB challenge.
(a) Survival rates of mice (n = 8) challenged with a lethal dose of SEB (10 μg) 24 h following treatment with Hm0487. (b) Comparison of survival rates in mice (n = 8) challenged with SEB 24 h post treatment with mAbs, demonstrating the synergistic effect of Hm0487 and Hm0313. (c–e) Cytokines levels in the serum of mice (n = 5) detected 6 h after SEB challenge. The histogram represents the concentrations of IFN-γ, TNF-α, and IL-6. Difference was compared by Log-rank (Mantel-Cox) test and One-way ANOVA, Tukey’s multiple comparison test. *p < .05, **p < .01, ***p < .001, ****p < .0001.
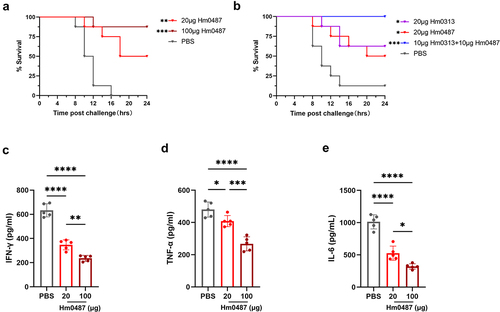
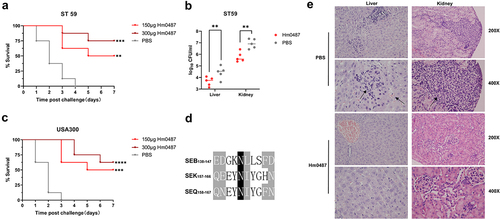
Figure 6. Hm0487 protect against S. aureus-induced sepsis.
Survival of mice (n = 8) administrated Hm0487 24 h before ST59 (a) and USA300 (c) challenge. (b) The bacterial burden in the liver and kidney of mice (n = 5) 3 days after ST59 challenge. (d) Multi-sequence alignment of different SEs. (e) Hematoxylin and eosin staining of liver and kidney sections at day 3 after infection. Images were captured at 200 × and 400 × magnification. Pathological changes were marked by black arrows. Data are presented as the mean ± SD, and the difference was compared by Log-rank (Mantel-Cox) test and two-tailed Student’s T test, **p < .01, ***p < .001, ****p < .0001.
Supplemental material
Supplemental Material
Download Zip (1.9 MB)Data availability statement
Data associated with this study are present in the manuscript or the supplementary information.